This section describes the process of forecasting future truck traffic volumes. The process corresponds to Step 3 and Step 4 of the ESAL Forecasting Process as shown in Figure 8-1.
18-KIP ESAL analysis primarily depends on truck traffic data. However, future truck traffic depends on the type of the proposed project, and hence the type of project dictates the methodology to be used in the 18-KIP ESAL analysis. The type of projects to consider are new construction (adding lanes), resurfacing, or reconstruction projects.
If the project involves the construction of a new road which includes additional lanes that will affect future traffic characteristics, the Project Traffic Forecast Process should be performed prior to calculating the 18-KIP ESAL.
The project engineer must request a Project Traffic Forecast for the facility in accordance with the Project Traffic Forecast Process.
If the project involves the resurfacing, reconstruction, or rehabilitation (RRR) of an existing roadway and does not include additional lanes, the historical trend analysis should be performed if historical data is available.
Determine if a Project Traffic Forecast for the facility has been completed. If a Project Traffic Forecast is available, check the validity of the data to be used in the ESAL calculation. If data are acceptable, obtain existing and future AADTs from the Project Traffic Forecasting Report. If the project traffic forecast is not available or invalid, then collect data and perform traffic forecasting.
Obtain existing and future AADTs, and number of lanes from the project traffic forecast analysis. If available, determine present and future truck traffic using appropriate T factors from the Annual Vehicle Classification Report. If historical data is not available, or the data cannot be used for the project, obtain truck data by conducting a 48-hour to 72-hour vehicle classification counts in accordance with the Traffic Monitoring Handbook. Determine truck traffic growth.
Historical and current truck volume data are available from FDOT’s Vehicle Classification Program (use Traffic Characteristics Inventory data, known as TCI). This may be used for estimating future truck traffic for projects whose limits encompass an FDOT classification count station. They may also be used for comparing roadways with similar characteristics (e.g., traffic, land use, etc.).
In many cases, future truck volumes can be obtained from regional models where regional economic conditions are considered. If an FDOT vehicle classification station is located within the project limits and the truck traffic forecast is not available from a FSUTMS-based travel demand model, a truck growth factor may be used to estimate future truck traffic.
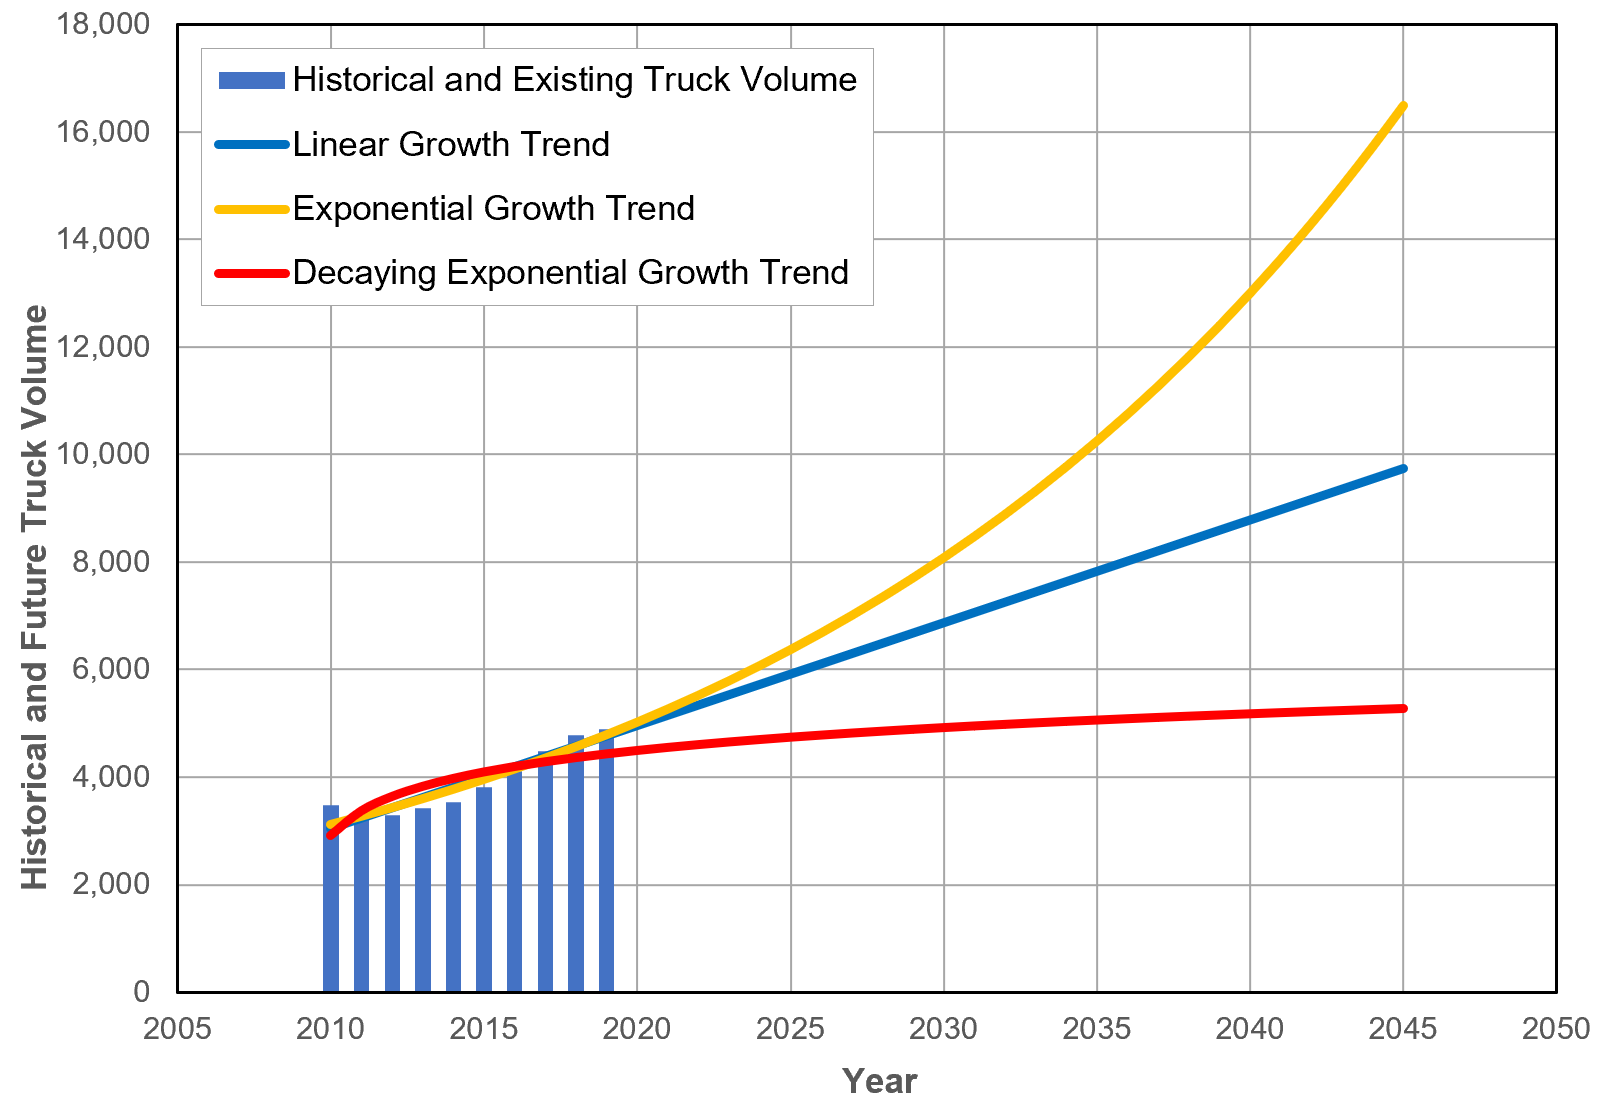
To determine the growth rate for a specific FDOT vehicle classification station, a historical trends analysis should be performed using the least square approximation (regression analysis) method. There are several methodologies that can be used, including Linear Growth, Exponential Growth, and Decaying Exponential Growth. Figure 8-3 shows an example of Truck Traffic Trend Analysis. The use of a particular growth pattern depends on the “goodness-of-fit” between the regression equation and the historical data as measured by R-Squared value. The FDOT Trend Analysis Spreadsheet Application can be used to perform the analysis. Detailed descriptions of the Spreadsheet Application can be found in Section 5.4.2 – Establish Traffic Growth Trend. Future land use changes and economic conditions should also be considered when determining the most appropriate growth rate. Future truck traffic shall be determined by applying the growth rate to the base year truck traffic for the desired number of years.

Percent Trucks (T)
T can be determined using the following methods:
- Vehicle classification count data – If a FDOT vehicle classification station is located within the project limits, the Percent Trucks (T24) is available in the TCI database or on the Florida Traffic Online (FTO) Web Application. The total percentage of Class 4 to 13 vehicles can be applied to the traffic projections to determine future truck volumes.
- Vehicle classification data collection – If there is no “active” FDOT vehicle classification station located within the project limits, then field data should be collected. Prior to implementing the field data collection, care should be taken to identify reasonable traffic breaks. The duration of the study should be scheduled to ensure data collection that would reflect an average day of truck traffic within the study area. Be sure to consider seasonal differences which may significantly increase the average traffic counts. For example, a count taken when numerous trucks are transporting produce to a market may dramatically increase the T24 average for the year.
- Note: Prior to accepting the field counts, the count data should be checked by comparing them to FDOT’s TCI or RCI data. If there is a minor difference, use the higher value. If the difference is large, then the field data should be reviewed for possible causes for the difference. Any unresolved differences should be documented.
The results obtained by either of the above methods should provide the total percent of vehicles in Classes 4 to 13. This can be applied to the project traffic projections to determine the future truck volumes.
Future Truck Volumes
Future truck volumes can be calculated using the following formula assuming a linear growth pattern as shown in Equation 8-1:
Assume that the base year truck traffic for a roadway segment for Year 2022 is 4,994. A growth factor of 3.2% has been determined based on trend analysis of truck traffic from the past ten years. Truck traffic for Year 2045 is desired.
In this example, the growth period equals 23 years (2045 - 2022 = 23). The base year truck traffic is factored by 23 years and by the rate of 3.2%.
\[Future\space{Truck}\space{Volume}=(4,994)\times{[1+(23\times{0.032})]}=4,994\times{1.736}=8,669\rightarrow{8,700}\]