The primary purpose of travel demand models is to provide system level traffic forecasts used to identify transportation needs in the development of long range transportation plans. The resulting transportation plans provide a basis for more detailed evaluation required for specific project developments. Project Traffic Forecasting Reports document the procedure, methodology, and data used to develop traffic forecasts that serve as the basis in establishing specific improvements, such as cross section requirements, lane calls for corridors, intersection/interchange geometry, and pavement design.
Models can be useful tools in developing the traffic projections necessary for the Project Traffic Forecasting Memorandum. However, before using traffic projections from a model, a careful examination of the performance of the model within the project area should be conducted to evaluate reasonableness and consistency of the model results. If necessary, additional model refinement and validation should be performed to ensure the model reflects the observed traffic conditions within the study area.
The travel demand forecasting models used in Florida for projecting systems traffic are developed based on the modeling standards set forth by the Florida Model Task Force (MTF) known as the Florida Standard Urban Transportation Model Structure (FSUTMS). MPO/TPO/TPAs previously developed and maintained their own individual models. However, with the increase in interregional travel and hence, the need for coordinated transportation planning, with a few exceptions, most MPO/ TPO/TPAs have their own models as part of a larger regional model. These regional models usually encompass multiple counties within an FDOT District. The District Planning Office, in coordination with each of the local MPO/TPO/TPA, are responsible for the development and maintenance of these models.
Models are typically calibrated and validated to reflect the travel behaviors as observed for a “base year”. The input data used for the model are population, employment, number of housing units, school enrollment, and the transportation network. The data sources needed to derive the observed travel characteristics include regional household travel surveys, National Household Travel Surveys (NHTS), most recent US Census, American Community Survey (ACS), Census Transportation Planning Package (CTPP), the Longitudinal Employer-Household Dynamics (LEHD) data provided by the US Census Bureau, local origin-destination surveys, external station survey, transit onboard survey, and other special purpose surveys. In recent years, “Big Data” provided by third party commercial vendors obtained from Global Positioning System (GPS) devices or Location Based Services (LBS) have been routinely used for model validation purposes because of the relative low cost and large sample size associated with the data. A model is considered validated when traffic volumes generated by the model match the traffic counts reasonably well for the base year, and the model is sensitive to changes in input data and responds to changes appropriately. After a model is validated, it can be used to forecast future traffic using the projected population and employment data and the transportation network for a future year.
Models that have been adopted by the FDOT districts and MPO/TPO/TPAs should be used first to develop future project traffic. Depending on the location and/or purpose of the project, the Turnpike State Model can also be used.
The parameters and coefficients in the validated models should not be modified without the consent and approval of the responsible agencies. Since the availability of models varies from district to district, users should contact the District Modeling Coordinator to obtain the available models.
This section presents an overview of modeling fundamentals as they relate to project traffic development. It covers basic travel demand forecasting procedures and modules used in various models in Florida, advanced modeling techniques, state-of-the-practice input and output data, accuracy assessment of model results, and the available models in Florida. For detailed methodological discussions, refer to various textbooks, National Cooperative Highway Research Program (NCHRP) reports, such as NCHRP 365, NCHRP 716, or NCHRP 735, and relevant modeling reports.
Travel Demand Forecasting Basics
All travel demand models start with a geographical representation of the transportation system, which consists of two parts. One is the demand side of the transportation system, represented by geographic areas or zones, and the traveling public that reside or work within the areas. The information needed to describe the traveling public is commonly known as zonal data and it includes household, person, vehicle, and travel related characteristics. The other is the supply side of the transportation systems, represented by multimodal transportation networks. The information used to describe the transportation networks and associated services includes number of lanes, capacity, type of facilities, speed limit, service schedule, etc. Travel demand models simulate the interactions between the supply side and demand side of the transportation system in different time slices based on observed or assumed travel behavioral principles and produce statistics that reflect the performance of the transportation system, such as volumes, congested speeds, and travel times and delays. Models are typically developed for regional long range transportation planning purposes. For many regional models, the zone size tends to be large, the transportation network could be sparse, and the model is often validated at a higher aggregate level. For project traffic purposes, a fine-grained zone system coupled with a high-level network detail is needed to properly reflect the traffic conditions within the project area. Model refinement and model adjustment are often needed.
Four-Step Travel Demand Modeling
There are different types of models based on planning requirements, data availability, and underlying assumptions about people’s travel decision making process. The sequential or four-step travel forecasting procedure is the most commonly used model for transportation engineering and planning purposes. The four-step model assumes that travelers make travel decisions in the following order:
- Trip Generation
- Determines the frequency of origins or destinations of trips in each zone by trip purpose
- "What do I need to do: Go to work, school, shopping?"
- Trip Distribution
- Matches origins with destinations
- "Where would I go: office, primary school, hospital?"
- Mode Choice
- Computes the proportion of trips between each origin and destination that use a particular transportation method
- "How should I go: Drive, get a ride, or use public transit?"
- Trip Assignment
- Allocates trips between an origin and destination by a particular mode to a route
- "What route should I take: shortest, fastest, cheapest, most familiar, safest?"
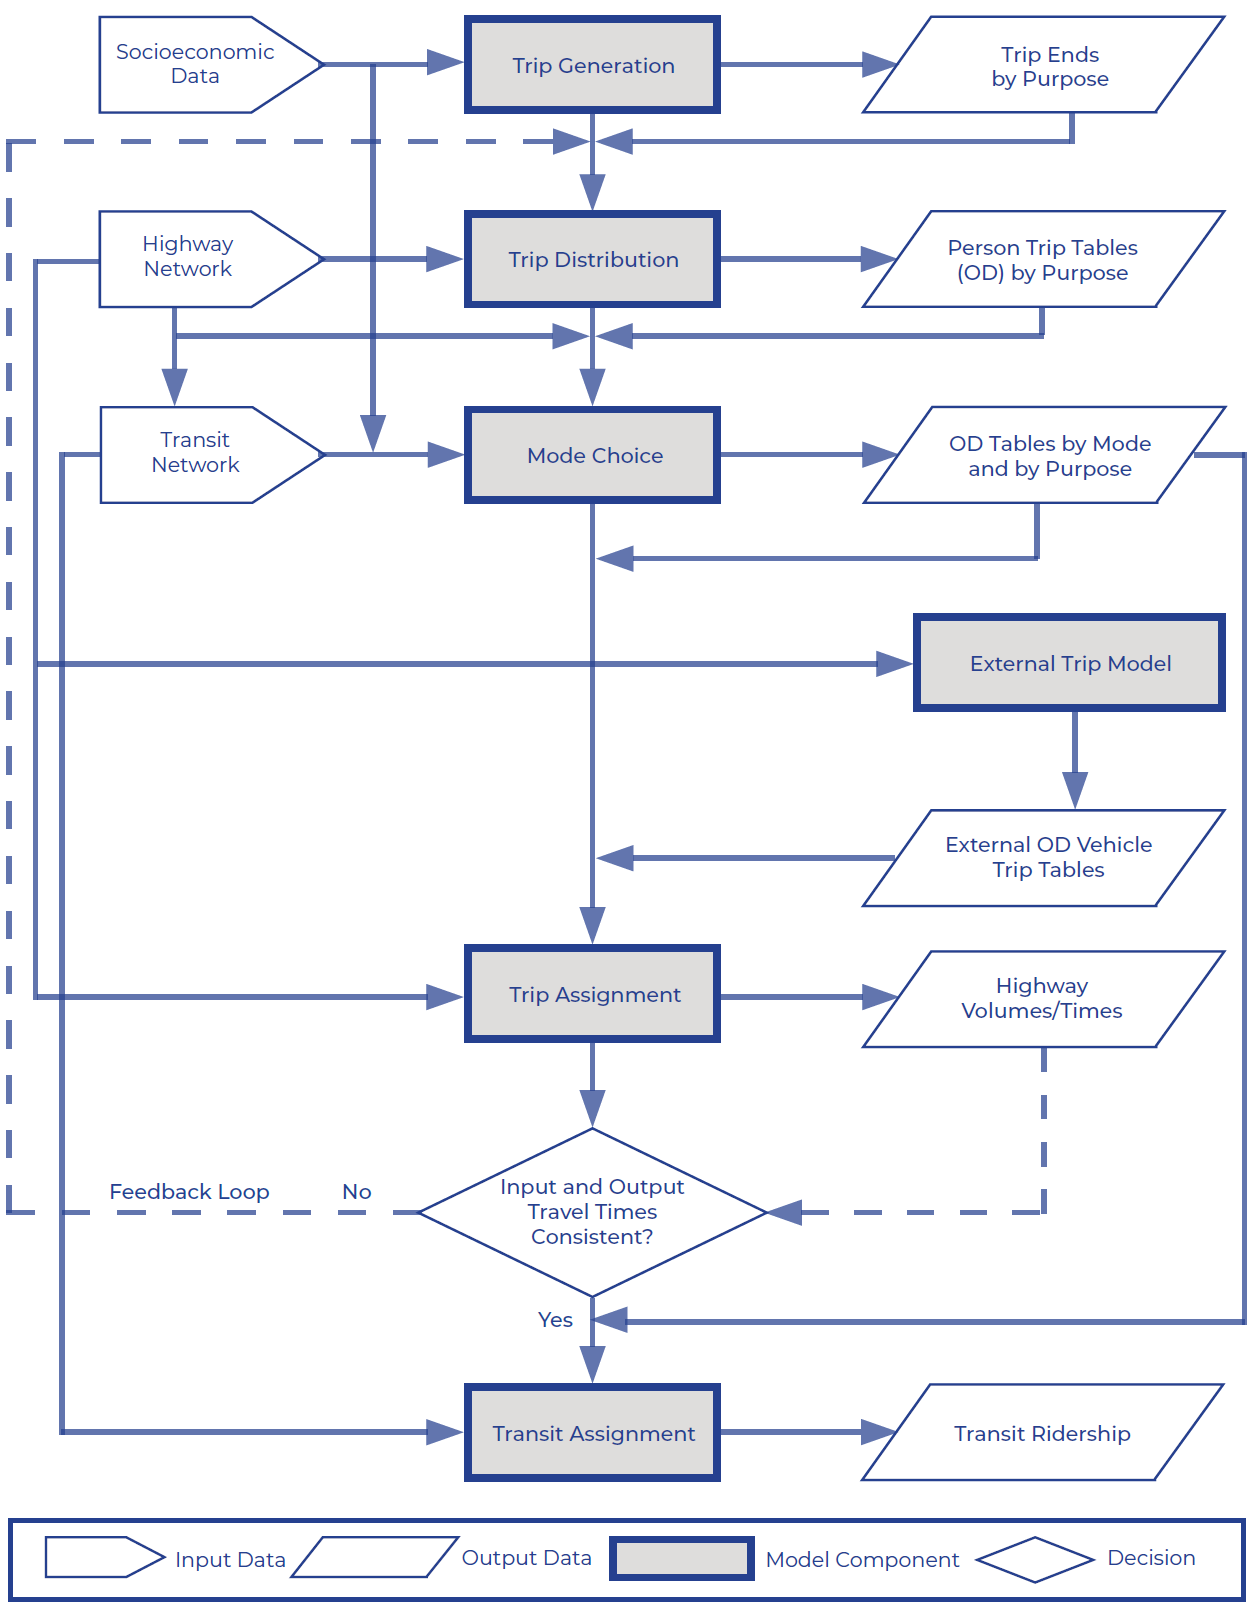
The four-step model is often referred to as the trip-based model because the primary unit of analysis is a single trip interchange between two geographic locations or an origin-destination pair. Even though there are different behavioral assumptions and mathematical formulations for each step, the primary function of the trip-based models is to estimate the total number of trips in a region, classify them by location and mode, and predict their use of transportation networks. Figure 4-3 illustrates a conceptual four-step modeling framework with main model components, input data, output data, and data flows among the model components. The model structure also includes a feedback loop used in some more advanced models to demonstrate possible improvements and enhancements to the model chain. Most of the travel demand models used in Florida are tripbased four-step models with various special features specifically designed to address the unique characteristics and planning needs in their modeling areas.
Four-Step Model Enhancements
There have been many enhancements within the four-step model framework to improve the accuracy and usability of the model. Examples include feedback loops that address the internal consistency issues within the model, time-of-day models that focus on travels during different time periods of the day, and various techniques that estimate trip tables directly from traffic counts or “Big Data” sources.
4.3.3.1 Feedback Loops
One of the common concerns about the sequential four-step models is the inconsistencies between the four steps, particularly the discrepancies between the travel times used for trip distribution and mode choice models and travel times produced by the trip assignment model. One way of resolving the inconsistencies is to implement the feedback loop in the model. The feedback loop is an iterative process, where congested travel times from the trip assignment model are “fed back” to earlier steps of the model until the differences between the steps are reduced to an acceptable level.
4.3.3.2 Time-of-Day Modeling
In most urban areas where traffic congestion is a daily occurrence, travelers respond to congestion by adjusting their departure time to avoid the heaviest traffic, thus prolonging the peak period, a phenomenon known as peak spreading. In recent years, increasing flexibility with work schedule and the availability of telecommuting further contribute to the changes in temporal distribution of travel demand. Many of the Travel Demand Management (TDM) measures or pricing policies are designed to reduce peak period traffic and alleviate traffic congestion. Various time-of-day (TOD) procedures and strategies have been employed to accurately capture the diurnal variations in travel demand and properly represent the traffic conditions during different times of the day.
Many of the models in Florida use TOD factors to disaggregate travel demand into different time periods. The TOD factors are developed either from household travel surveys or from traffic counts in the region. Within the four-step modeling framework, there are typically two ways of applying the TOD factors: one is to apply the TOD factors after trip assignment to allocate daily volumes into different time periods, the other is to apply the TOD factors before trip assignment to determine the travel demand separately for each period. In the latter case, separate trip assignment procedures are performed for different time periods to obtain traffic volumes for each period and the daily volume is the sum of all period volumes.
There are also models in Florida that use more advanced techniques, such as TOD choice models. TOD choice models focus on predicting trip departure times based on preferred arrival time, expected and experienced travel times, and sometimes, arrival delay penalties.
4.3.3.3 Direct Estimation of Origin-Destination Trip Table
The Origin-Destination (O-D) trip table, or O-D matrix, is a crucial element in describing the travel pattern in a region or for a study corridor. A well calibrated trip distribution model should be able to produce a trip table that properly represents the observed travel pattern. However, in many cases, the trip table obtained from the model may not meet the requirements for a study, and it is often necessary to estimate the O-D table from other sources. One of the most commonly used methods is to estimate the trip table from traffic counts. The method tries to find a reasonable O-D table that will match the traffic counts when assigned to the transportation network. On large networks, there are multiple O-D tables that will reproduce traffic counts equally well, so additional information is needed to help determine the “best match”. Additional information is often supplied in the form of a “seed matrix” that could be an observed trip table in the past or an “educated” approximation of the desired outcome. This process is sometimes referred to as Origin-Destination Matrix Estimation (ODME) and is included in many modeling software packages.
The ACS/CTPP data and LEHD data are often used to directly estimate work-related trip tables for existing years. Bluetooth and Wi-Fi technologies are used to collect vehicle information and develop trip tables based on matched Media Access Control (MAC) addresses, particularly for a small study area or a corridor. In recent years, third party commercial data has offered a cost-effective alternative to develop trip tables for areas of all sizes.
It is important to remember that the O-D tables directly estimated from these data sources represent trip interchanges for the base year or existing year. The base year O-D tables need to be scaled up using growth factors developed from socioeconomic data or other data sources to obtain O-D tables for future years. A set of trip interchange differences and ratios needs to be computed between the original and ODME trip table, and then use the developed deltas to adjust the future year model trip table. Additionally, some capping is required for deltas so as not to completely overwrite the demand model distributions.
Activity-Based Models
Activity-Based Models (ABM) represent a paradigm shift from the traditional four-step models for Travel Demand Forecasting. Instead of focusing on individual trip exchanges, ABM models consider people’s daily activities as the primary source of travel demand, and individual modules are developed to predict the time, location, duration, partners/companions, and travel choices people make to conduct the activities.
ABM models share some similarities with the traditional four-step models: activities are generated, locations for the activities are identified, travel modes are determined, and the specific routes used for each trip are predicted. However, activity-based models offer significant advantages over the trip-based four-step models. Both the geographic area and time slices are much smaller, allowing for more realistic representation of space and time. Daily activities and travel choices are joint decisions made by household members. An ABM model typically begins with a population synthesizer that uses statistical procedures and census data to create a synthetic population for the entire modeling area. The model will then simulate activity patterns of each person in the synthetic population, effectively generating individual travel records similar to those obtained from a household travel survey. The activity travel records can then be aggregated into trip tables for either traditional static trip assignment or more advanced Dynamic Traffic Assignment (DTA) procedures. The disaggregate nature of the ABM models provides a full range of quantitative measures to represent travel activities and choices, and makes it easier to evaluate the effectiveness of some of the TDM strategies and pricing policies, such as telecommuting and managed lanes. ABM models have been developed for some of the urbanized areas throughout the state, even though the actual implementation is somewhat different for each of those models.
Travel Demand Models Available in Florida
The Florida Transportation Forecasting Forum (TFF), formerly the Florida Model Task Force (MTF), in coordination with FDOT Central Office and districts, MPO/TPO/TPAs, and other local planning agencies, develop and maintain modeling standards and guidelines for Florida, collectively referred to as FSUTMS. FSUTMS establishes common frameworks including methodologies, file structure, naming convention, and model calibration/validation standards, while allowing special features to model unique travel characteristics and address special planning needs in each District. The availability of models varies from district to district. The District Planning Office should be contacted to obtain the most suitable model for project analysis. Figure 4-4 shows the models that are currently being used in Florida, including the type of model and modeling area associated with its model.
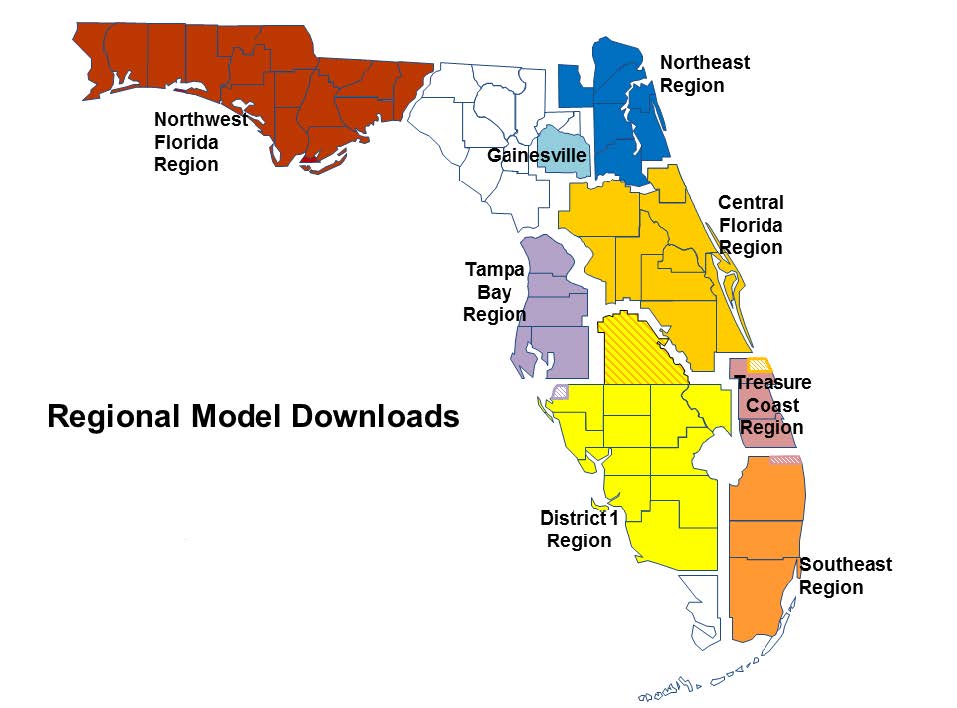
The Florida web portal also has a list of available models on its Statewide and Regional Models Downloads page. Users are advised to always consult with District Planning Offices for any change or update of these models. It is noted that there is a change in modeling platform from Cube to PTV Visum and TransCAD. The Transportation Forecasting Resource Hub replaces FSUTMS Online and offers downloads of travel demand models and modeling guidance and training resources, as well as information on the Florida Transportation Forecasting Forum (formerly the Florida Model Task Force). The available models in Florida for download include:
- Northwest Florida Regional Planning Model (NWFRPM)
- Coverage: Entirety of District 3
- Model Type: Four-step
- Model Output: Peak Season Weekday Average Daily Traffic (PSWADT)
- Northeast Florida Regional Planning Model (NERPM)
- Coverage: Nassau, Baker, Duval, St. Johns, Clay, and Putnam Counties
- Model Type: Activity-based
- Model Output: AADT
- Gainesville/Alachua County Model
- Coverage: Alachua County
- Model Type: Four-step
- Model Output: PSWADT
- Central Florida Regional Planning Model (CFRPM)
- Coverage: All District 5 MPOs, including Polk County and a portion of Indian River County
- Model Type: Four-step
- Model Output: PSWADT
- Tampa Bay Regional Planning Model (TBRPM)
- Coverage: Citrus, Hernando, Pasco, Pinellas, and Hillsborough Counties, as well as a portion of Manatee County
- Model Type: Four-step
- Model Output: PSWADT
- Treasure Coast Regional Planning Model (TCRPM)
- Coverage: Indian River, St. Lucie, and Martin Counties, as well as a portion of Palm Beach County
- Model Type: Activity-based
- Model Output: AADT
- District 1 Regional Planning Model (DIRPM)
- Coverage: Entirety of District 1
- Model Type: Four-step
- Model Output: AADT
- Southeast Regional Planning Model (SERPM)
- Coverage: Palm Beach, Broward, and Miami-Dade Counties
- Model Type: Activity-based
- Model Output: AADT
- Turnpike State Model (TSM)
- Coverage: Statewide
- Model Type: Tour-based
- Model Output: PSWADT
The primary factors to be considered when selecting an appropriate model are as follows:
- Does the model comply with FSUTMS standards?
- Is the model designed for the type of project?
- Is the model the officially released version?
- Does the model include a future year alternative with approved socioeconomic data and transportation network?
- At what level is the model validated (systemwide, district, corridor)?
The use of a non-FSUTMS model is normally not acceptable in areas where a FSUTMS-based model has been developed. However, if all adopted/endorsed FSUTMS models are shown to be inadequate for future travel demand forecasts, a non-FSUTMS model may be recommended, or a combination of approaches may be used. In such cases, it should be documented why none of the adopted/ endorsed FSUTMS models can be used. The District Planning Office should be contacted for approval prior to the use of a non-FSUTMS model.
Florida Transportation Forecasting Forum (TFF)
To ensure that travel forecasting in Florida continues to provide valuable information, FDOT Systems Forecasting & Trends Office (SFTO) engaged a working group to brainstorm the next generation of travel demand modeling and travel forecasting. The working group met several times between September 2022 and July 2023, to provide ideas on how to develop Florida’s travel forecasting practice moving forward. These contributions culminated in the identification of three core principles:
- Relevancy & Timeliness
- Accessibility & Communication
- Consistency & Efficiency
Placing these core principles at the center of travel forecasting and modeling work ensures that the state of the practice advances in ways that support the public interest and provide added value to decision-makers.
The Florida TFF, formerly the Florida MTF, employs task-oriented committees made up of volunteer members charged with developing guidance, tools, and other products to advance the state of the practice. SFTO provides technical staff support to each committee. This collaboration between SFTO and the TFF allows for an incremental and iterative process ensuring Florida’s travel forecasting and modeling practice is effectively meeting the needs of users now and in the future.
For additional information of the Florida TFF, please check the Transportation Forecasting Resource Hub. This hub provides information to support transportation-related forecasting, including travel demand modeling. The users can find guidance and manuals, download models, access shared data, and register for upcoming training events.