The following example shows the steps to be performed to develop project traffic for a road widening project in Columbia County. Columbia County is not currently covered by any of the regional models in Florida. To forecast future year traffic for roadways in Columbia County, trend projection procedures will be used. This example also serves as a demonstration of the use of the FDOT Trend Analysis Tool.
Step 1:
Assemble Available Data
1. Project Location Map
The project is located on I-10/SR-8 near CR-250 Overpass in Columbia County. It currently has two lanes in each direction. The project requires Year 2045 AADT at this location to determine the number of lanes needed in the future. Figure 5-1 shows the project location.
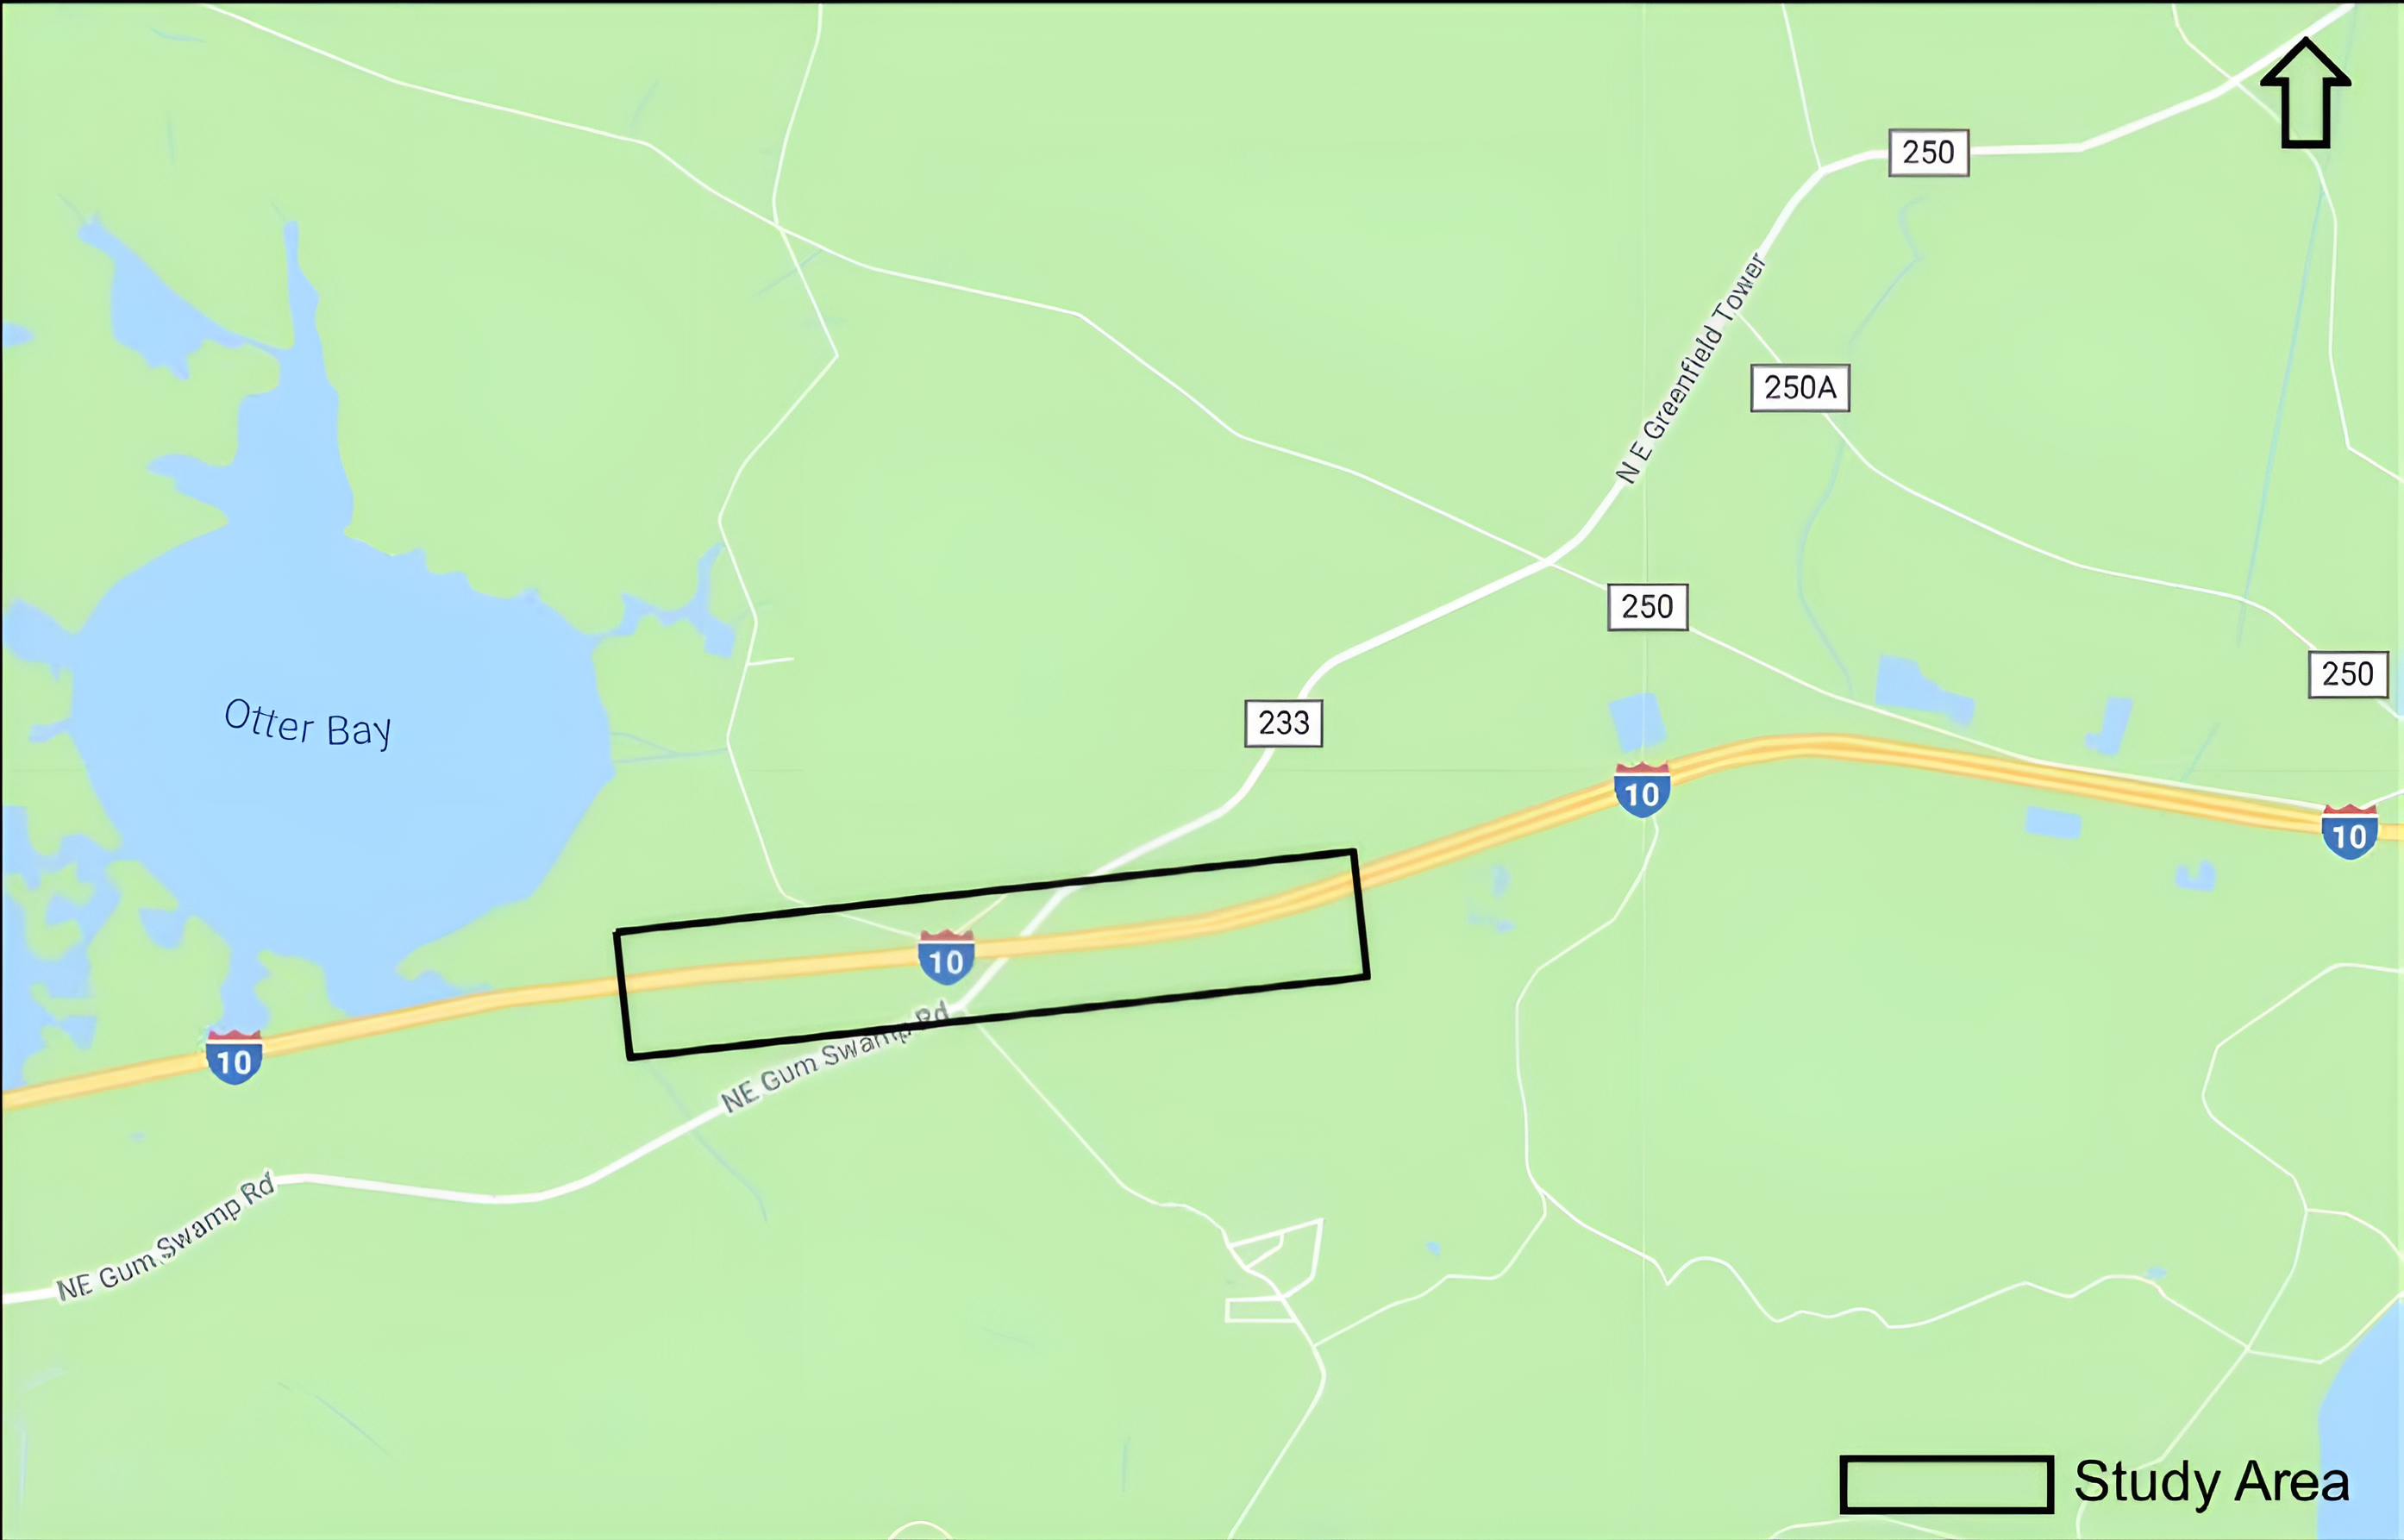
Figure 5-1 I-10/SR-8 Project Location Map
2. Historical Traffic Counts
Based on Traffic Information Online, Continuous TMS 299936 is located within the study area, and historical traffic counts are available from 2007 to 2022. (See Figure 5-2 and Figure 5-3).
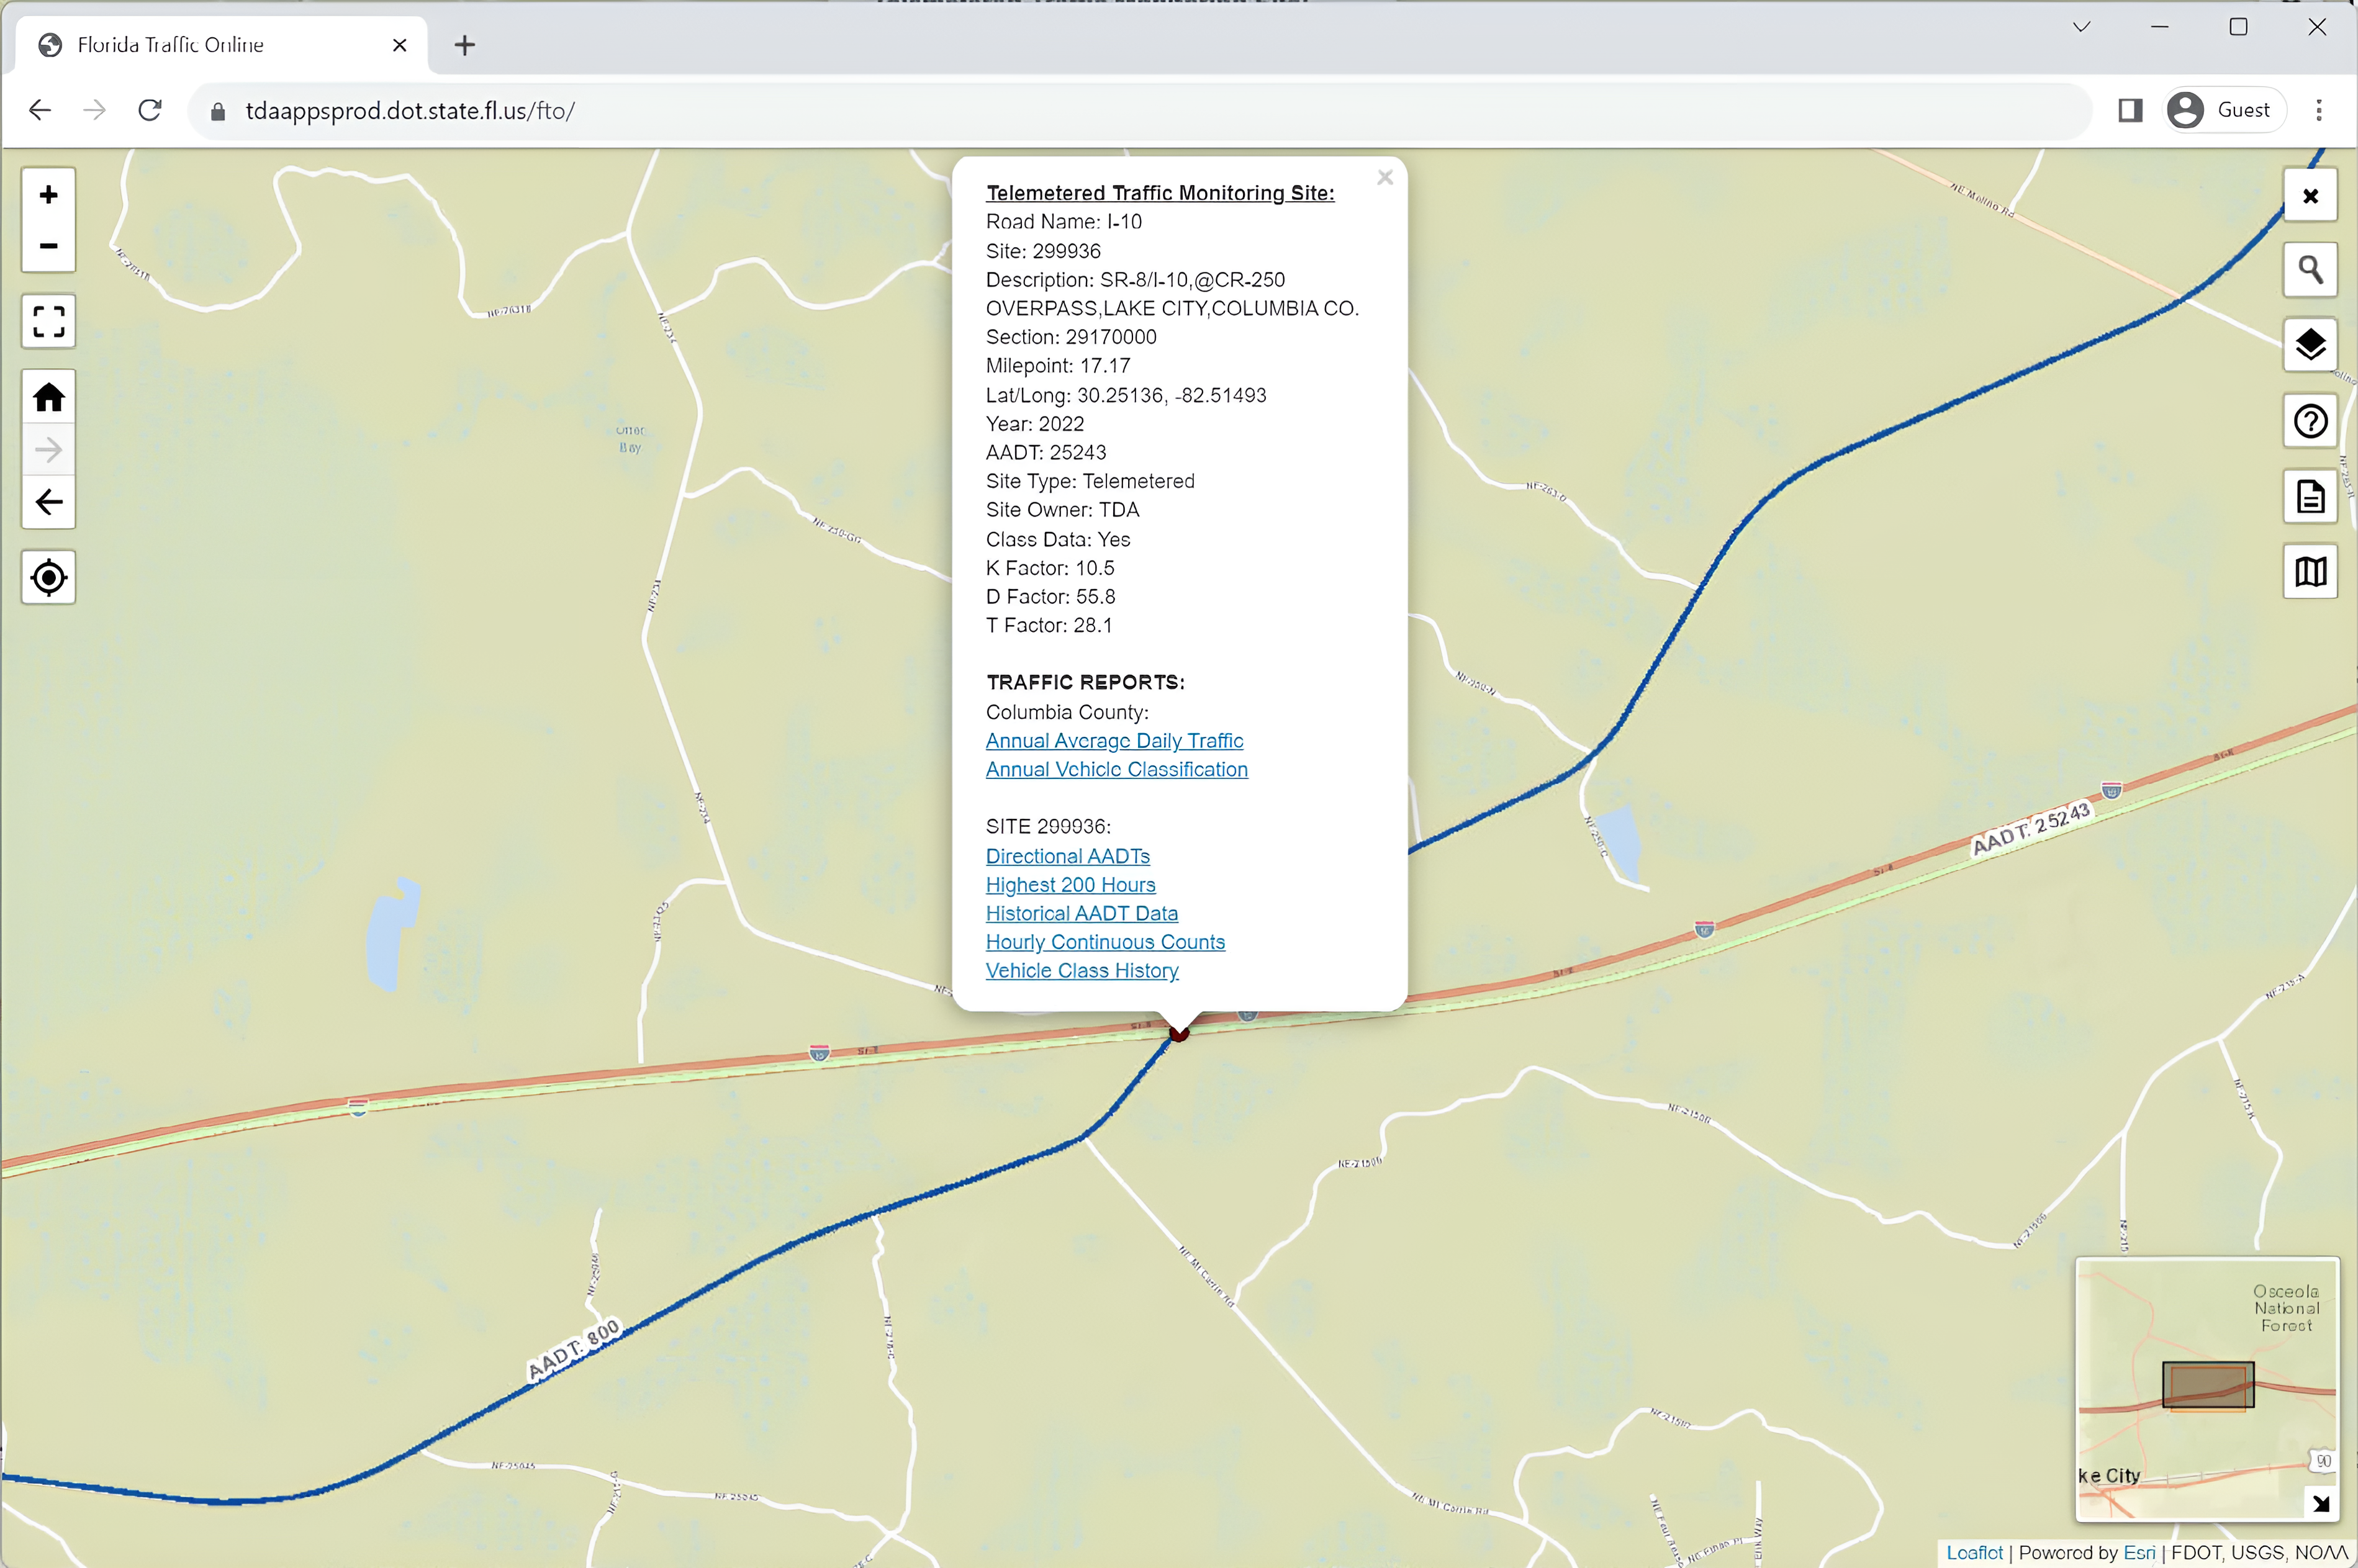
Figure 5-2 Continuous Count Site within Study Area
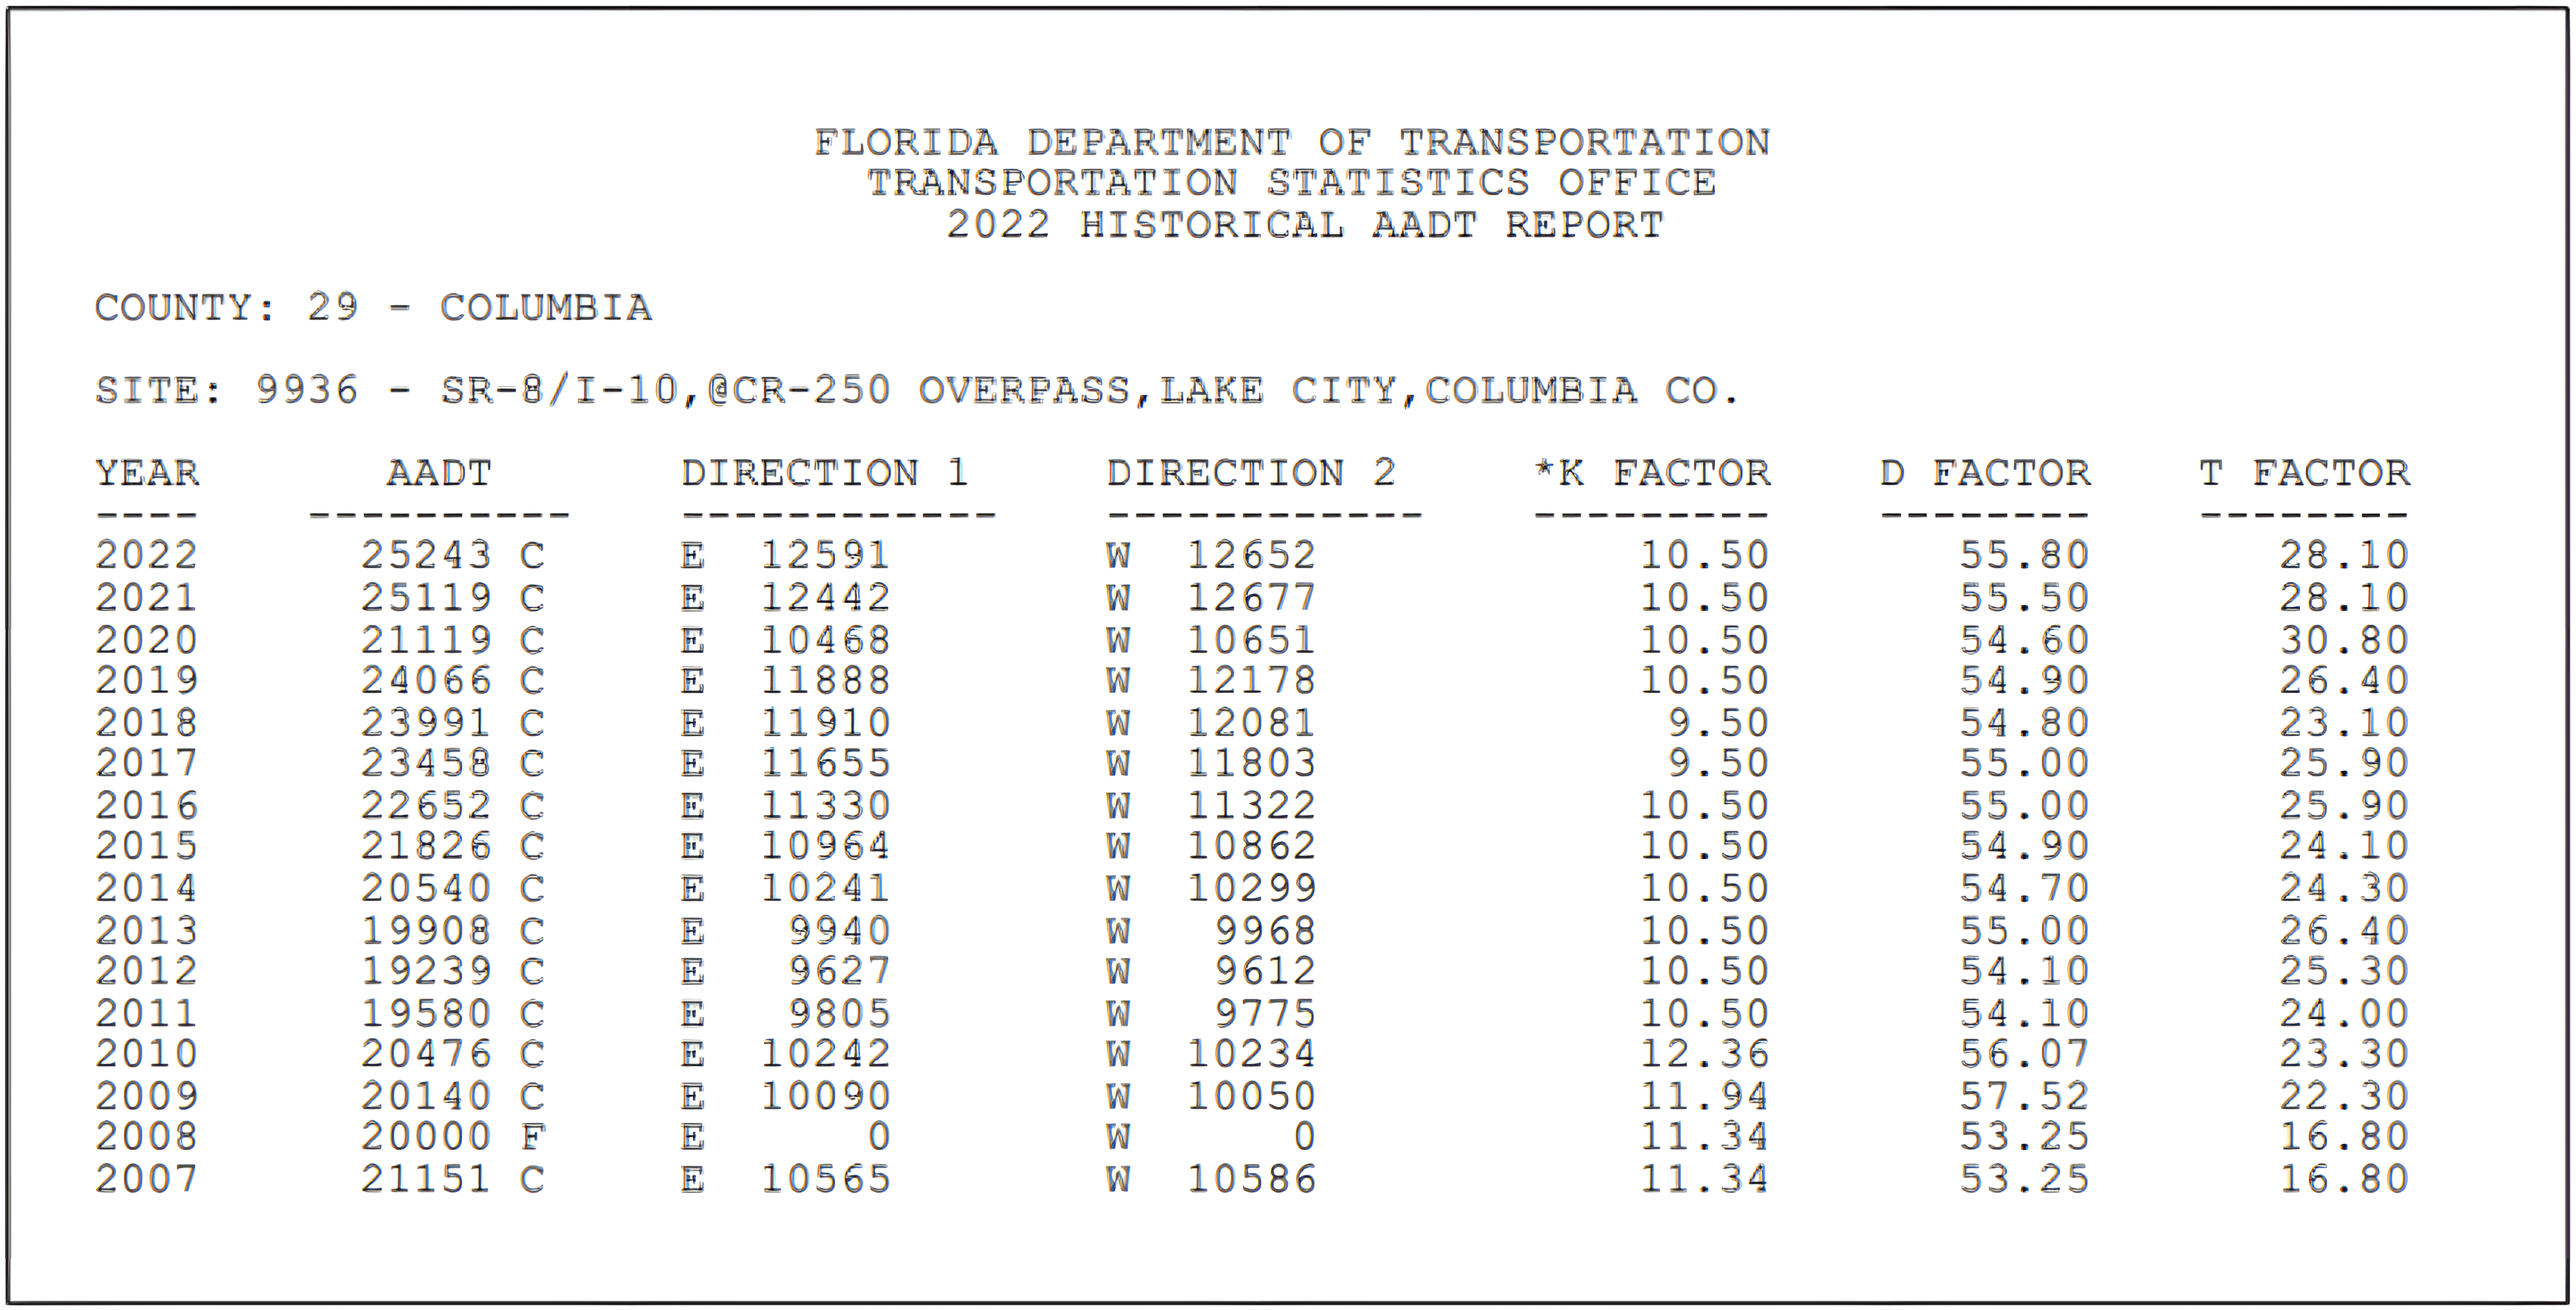
Figure 5-3 Historical Trend Analysis Summary6
3. Historical Population Data
The Bureau of Economic and Business Research (BEBR) publishes annual population estimates by county by district on their websites. Historical population data can be obtained from these sources. Table 5-1 shows the historical population for Columbia County for the ten years from 2013 to 2022.
Table 5-1 Historical Population Estimates for Columbia County
| Year | 2013 | 2014 | 2015 | 2016 | 2017 | 2018 | 2019 | 2020 | 2021 | 2022 |
|---|---|---|---|---|---|---|---|---|---|---|
| Population | 67,489 | 67,826 | 68,163 | 68,566 | 68,943 | 69,721 | 70,492 | 69,698 | 69,809 | 71,525 |
4. FDOT Population Projections from 2025 to 2045
The SFTO publishes population projections by county. The most recent available data is for Years 2020 to 2045 in five-year increment adjusted based on 2022 population estimates. Table 5-2 shows the population for Columbia County for Census Year 2020, Year 2022, and projections for the years 2025 to 2050.
Table 5-2 FDOT Population Projections for Columbia County
| Year | 2020 | 2022 | 2025 | 2030 | 2035 | 2040 | 2045 | 2050 |
|---|---|---|---|---|---|---|---|---|
| Population | 69,698 | 71,525 | 73,300 | 75,400 | 77,000 | 78,400 | 79,500 | 80,600 |
Step 2:
Conduct Regression Analysis using Historical Traffic Data
The Traffic Trends Analysis Tool is a macro-based spreadsheet application developed by FDOT to perform historical trend analysis from specified FDOT sites or user defined locations. The tool can be downloaded from the FDOT Systems Implementation Office (SIO)'s website. This Excel spreadsheet includes tabs of Instructions, Main Menu, Output, and Summary. The steps for trends analysis are described as follows:
- Open Main Menu and click Data Input, then enter Project Information. The project information includes FM number, County, location of the Florida Traffic Online (FTO) Database. The FTO database can be downloaded from the TDA website. This information is optional and only for project identification purposes. Future projection years include opening year, interim year, and design year. Up to 10 FDOT count stations can be analyzed at one time. FDOT count station numbers need to be entered. Figure 5-4 shows the Project Information screen for Count Station 299936.
- Enter Station Information. The station information will be automatically filled in if the FDOT count station is specified. The station information can be typed in if the site is not an FDOT count station. Project Location, Roadway Section ID, Axle Correction Factor are the input for the project if the information needs to be changed for the project. The first year and last year of AADT volumes are the first year and last year of the AADT used for the historical trend analysis. Once the first year and last year of AADT volumes are specified, click on the "Import Historical AADT" button to load the historical AADTs from first year to last year from the FTO database. If the database location is not specified, a dialog will prompt to show that the database is not specified and will go back to Project Information tab. FSUTMS model data includes the availability of FSUTMS model volumes, number of years of the FSUTMS model, years of each model, and model volumes. In this example, a typical 10-year AADT dataset from 2010 to 2019 was used. More recent data from 2020 to 2022 was not used because a careful examination of the data determined that those data were still under unusual conditions. The use of AADT data during abnormal conditions for historical trend analysis requires careful consideration, contextual analysis, and potentially adjustments to account for anomalies. Long-term forecasting should recognize the unique circumstances of the abnormal conditions when making decisions. Figure 5-5 shows the Input Data screen for Site 299936.
- Once the historical data is imported or typed in, click on the "Preview Graph" Button to preview the trends analysis graphs using Linear, Exponential, and Decaying Exponential methods. Figures 5-6 to 5-8 show an example of three trends analysis graphs for the FDOT count station 299936.
- Print results. Click on the "Print" button to print the trend analysis graphs for all the sites at one time.
- View Results summary: open Main Menu and click "Analysis Summary" button to show the summary of the trend analysis results for all the sites. Table 5-3 shows the analysis summary for Site 299936.
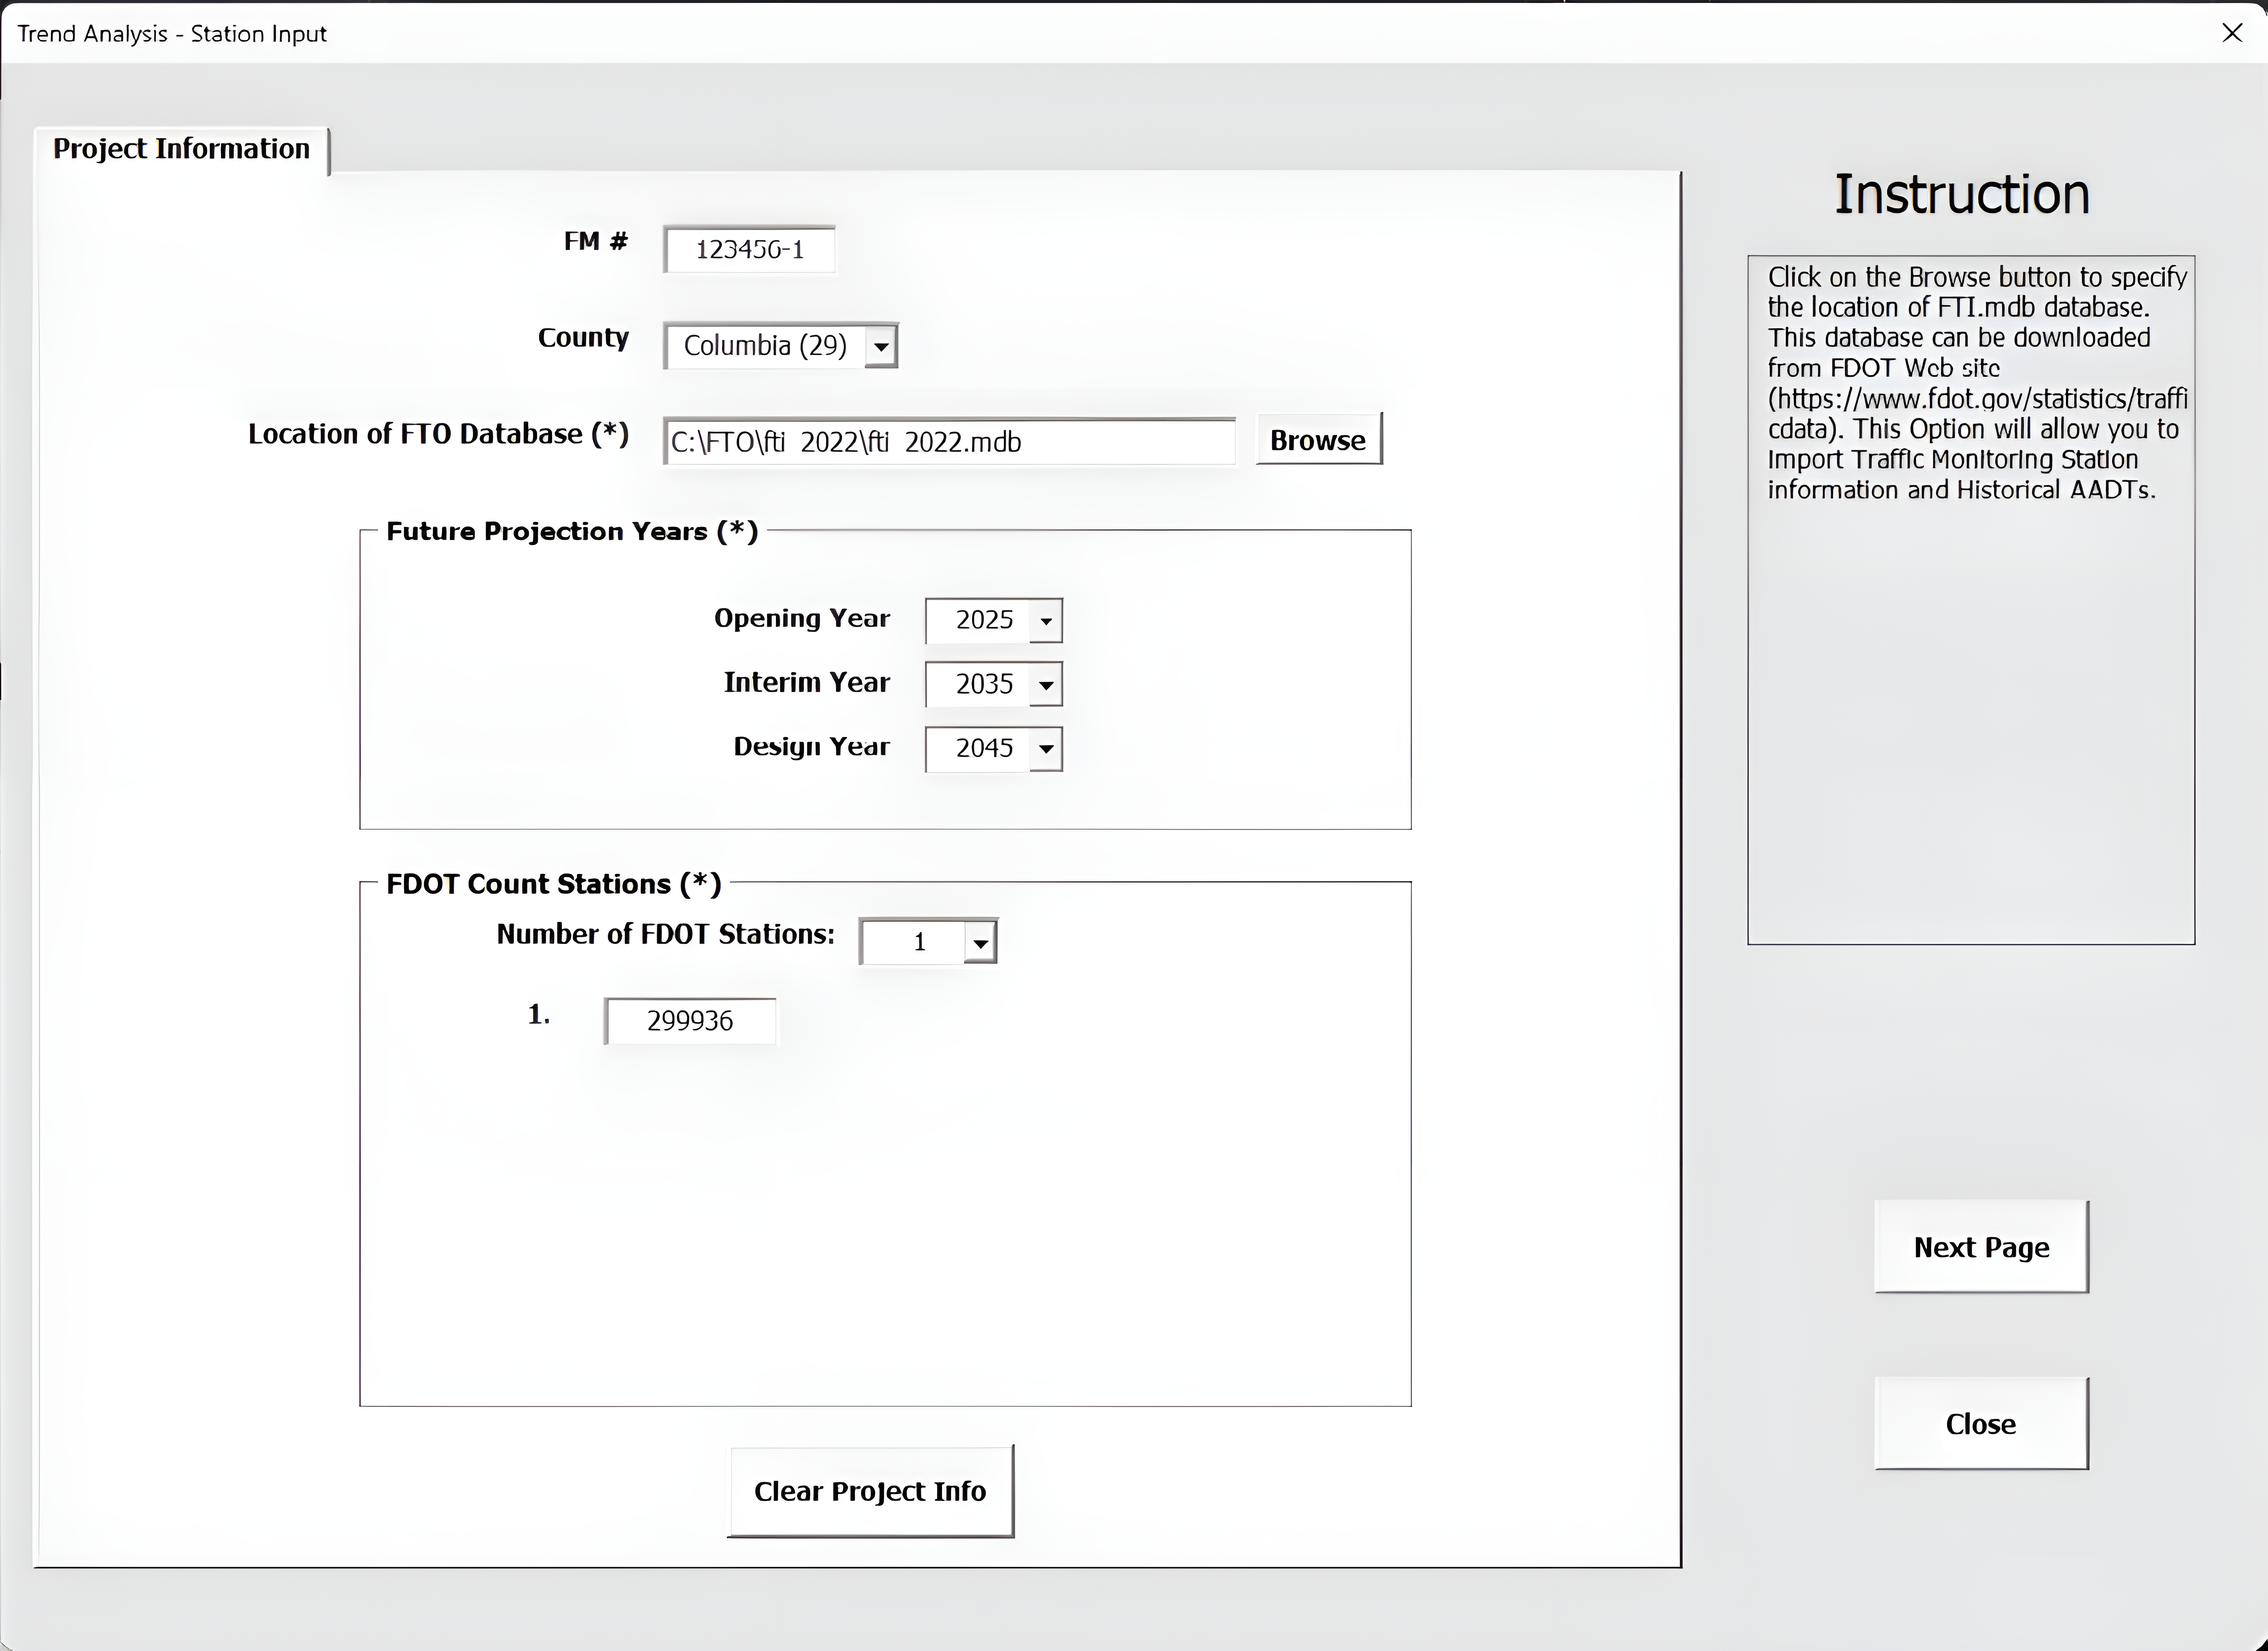
Figure 5-4 Trend Analysis Tool Project Information Input Screen
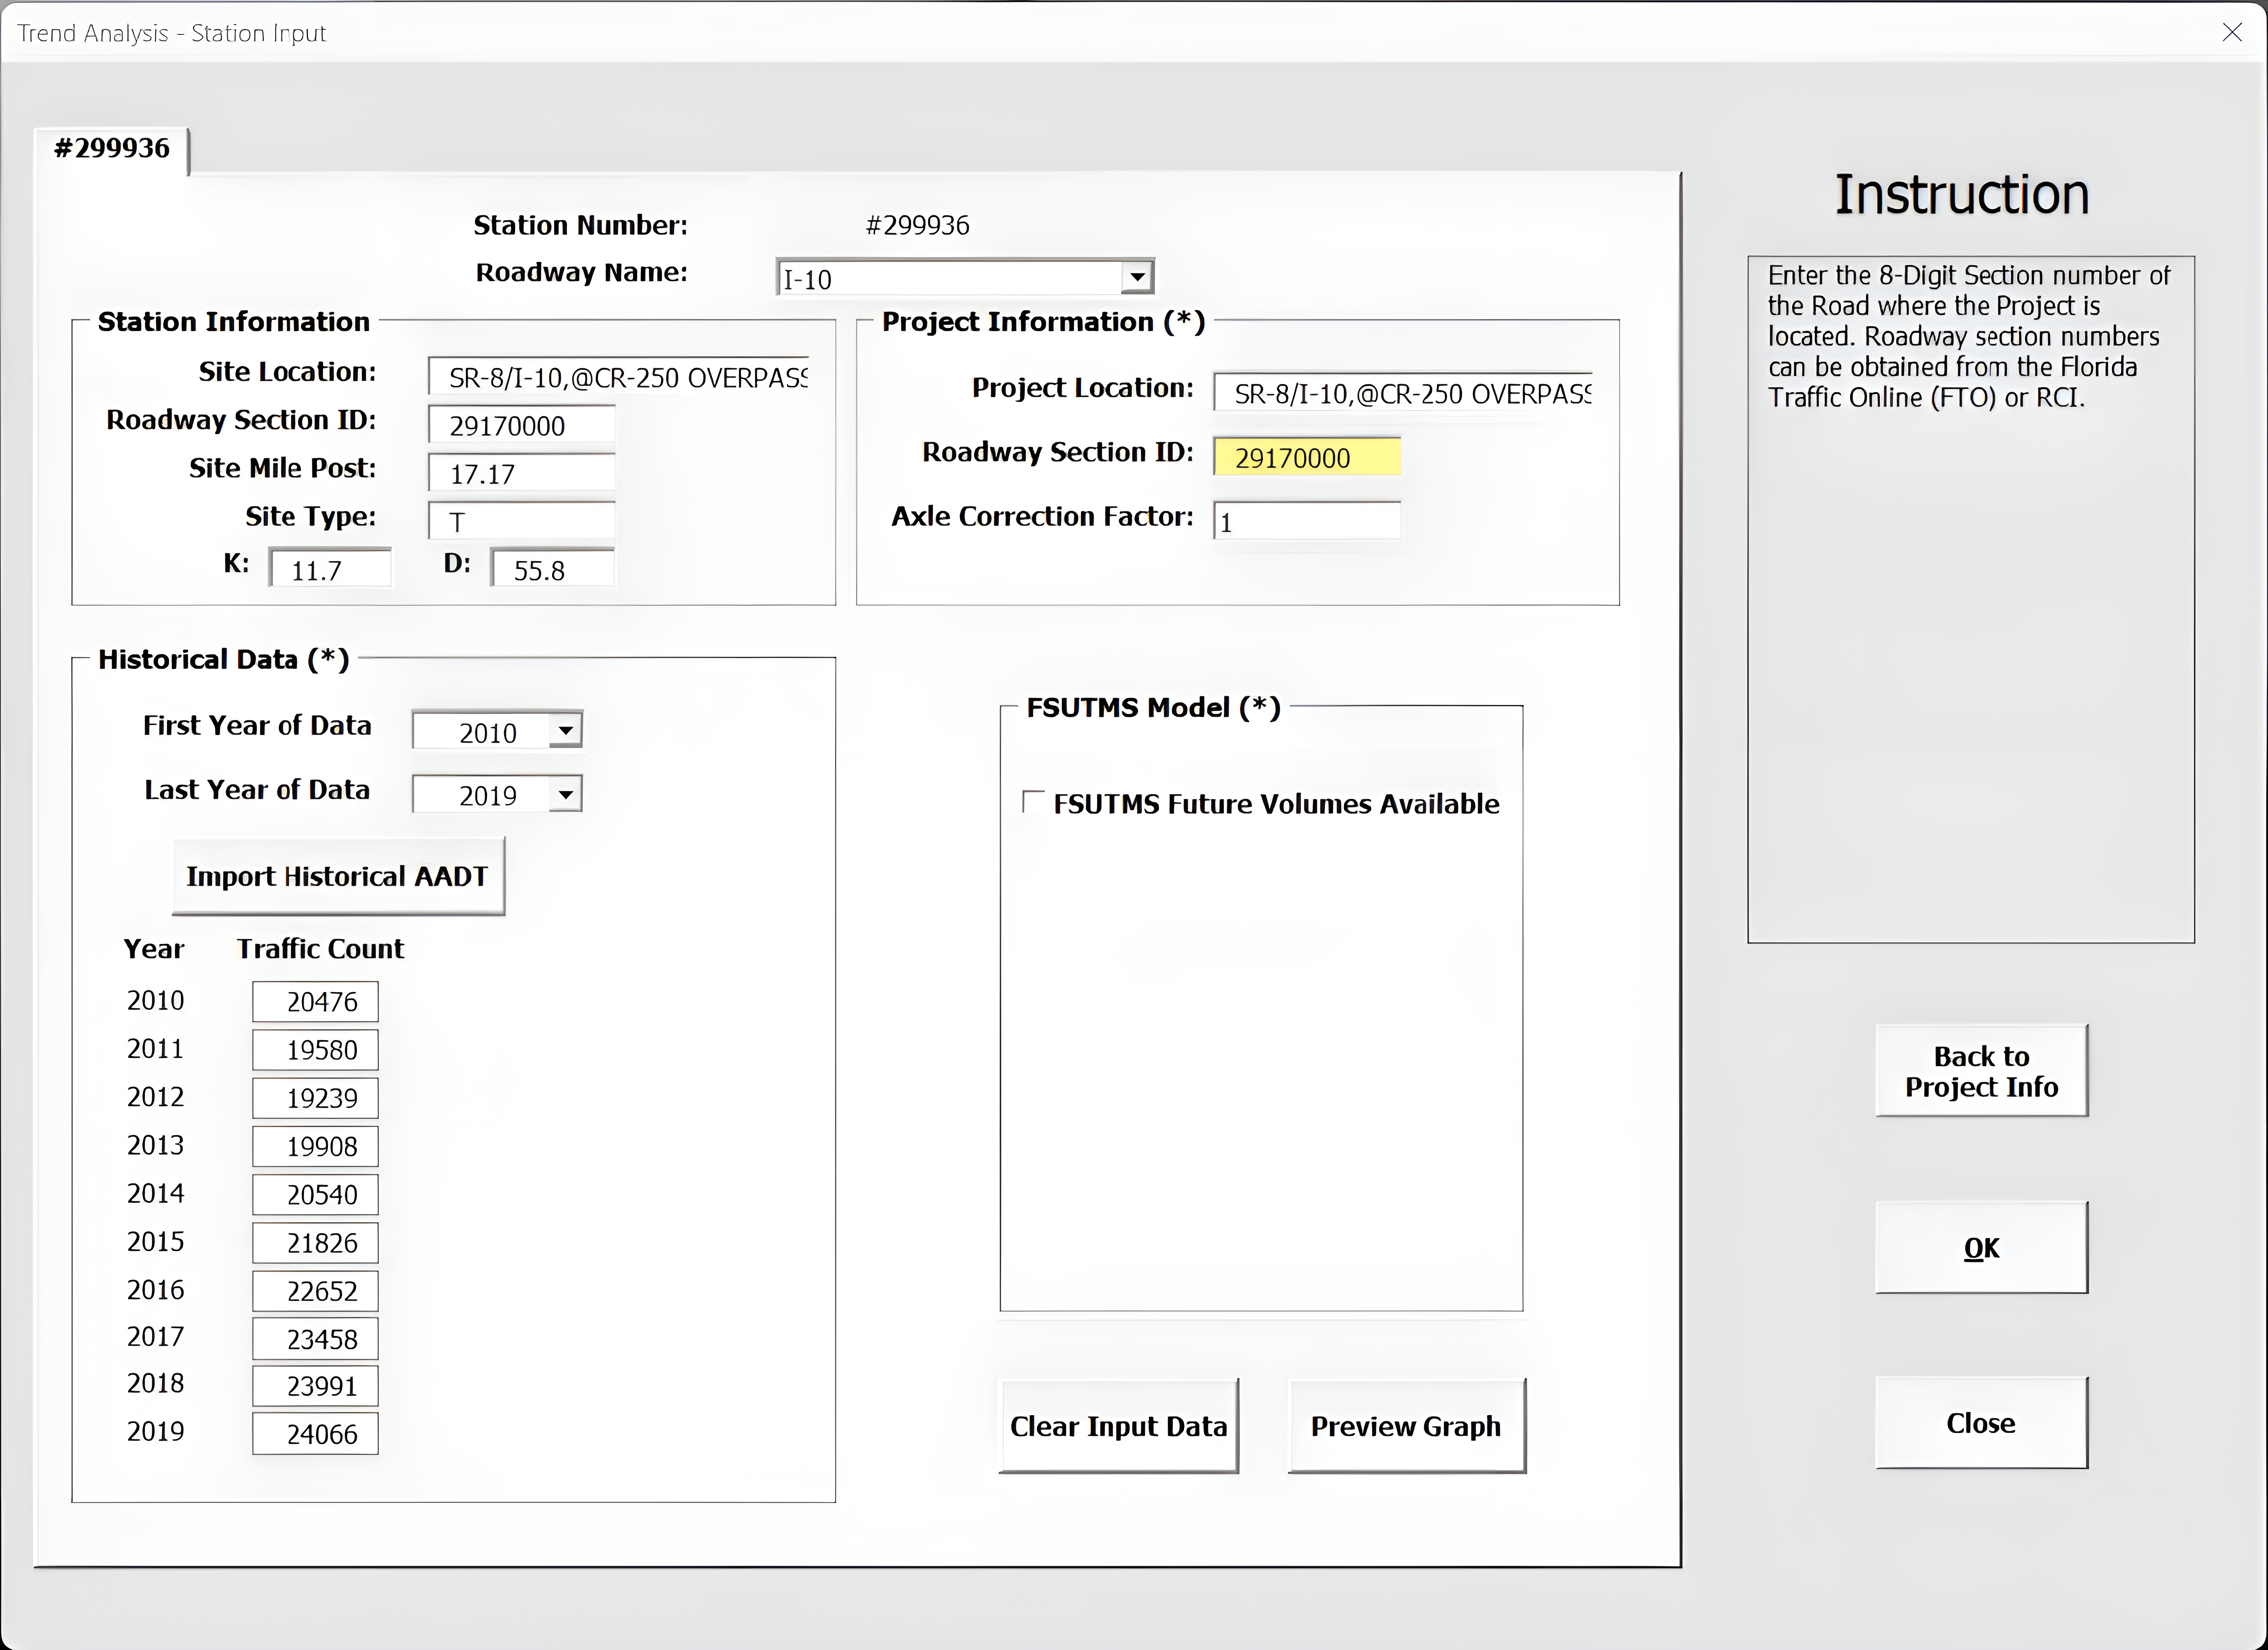
Figure 5-5 Trends Analysis Station Information Example
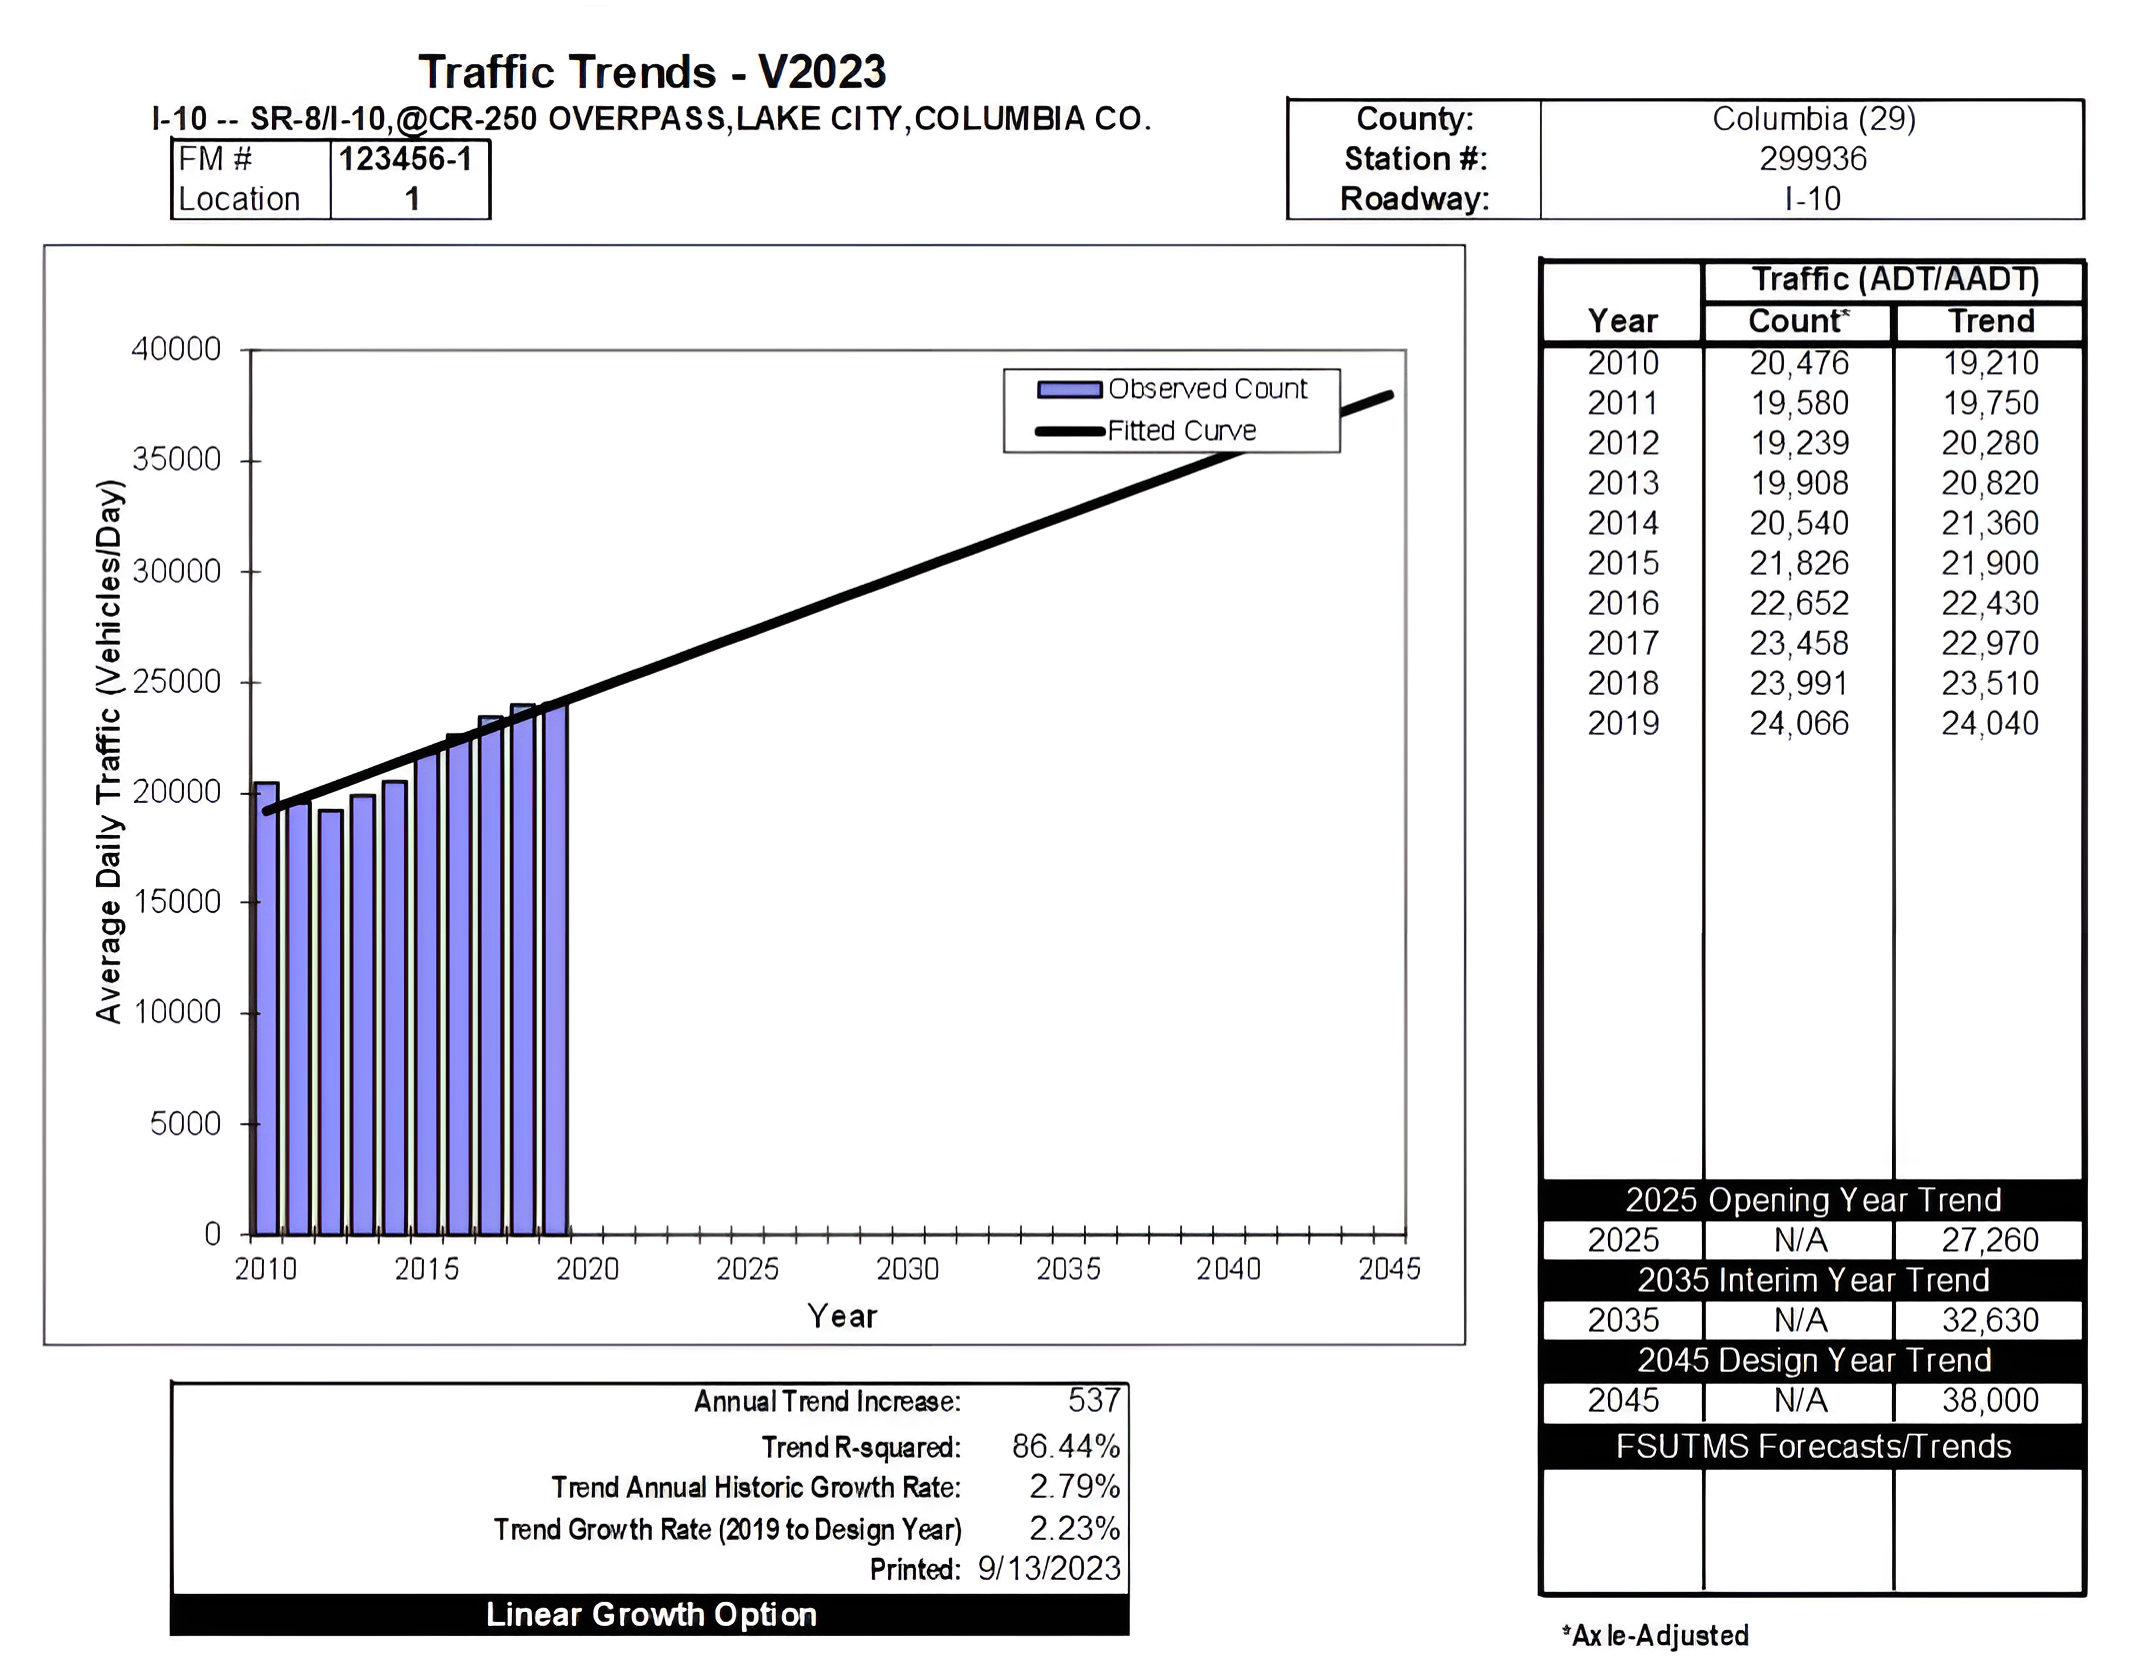
Figure 5-6 Trend Analysis Linear Growth Pattern
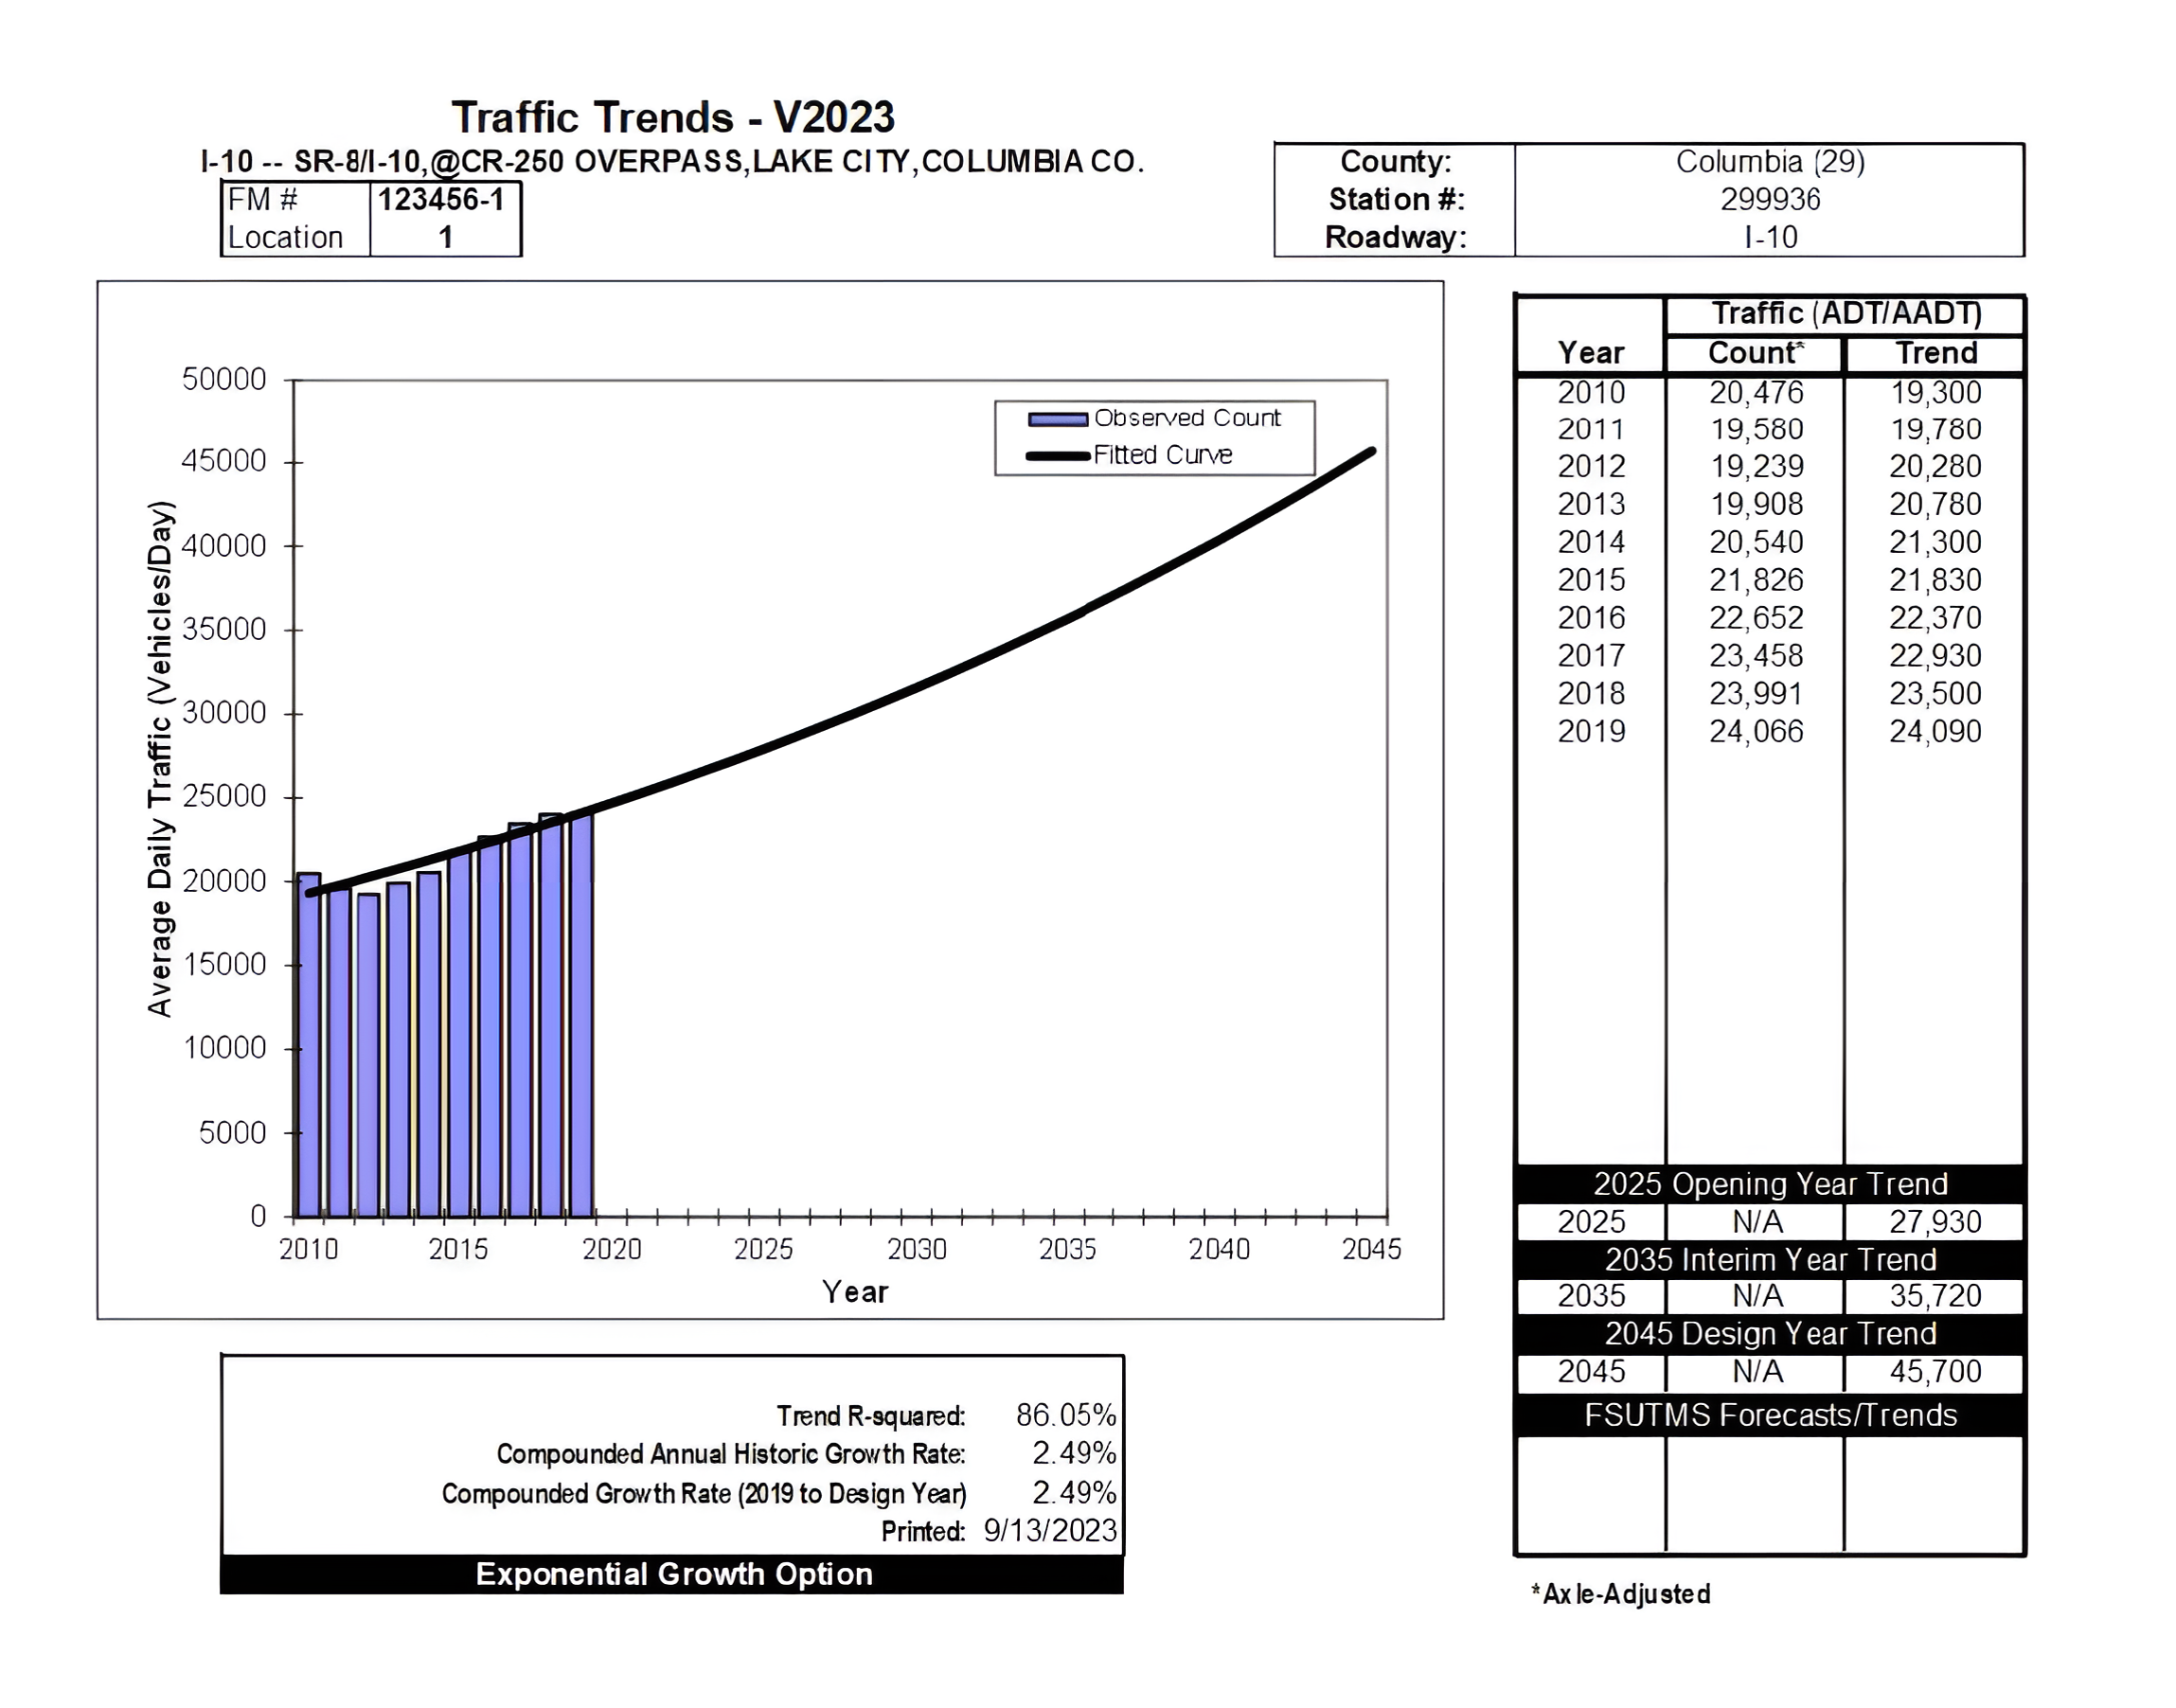
Figure 5-7 Trend Analysis Exponential Growth Pattern
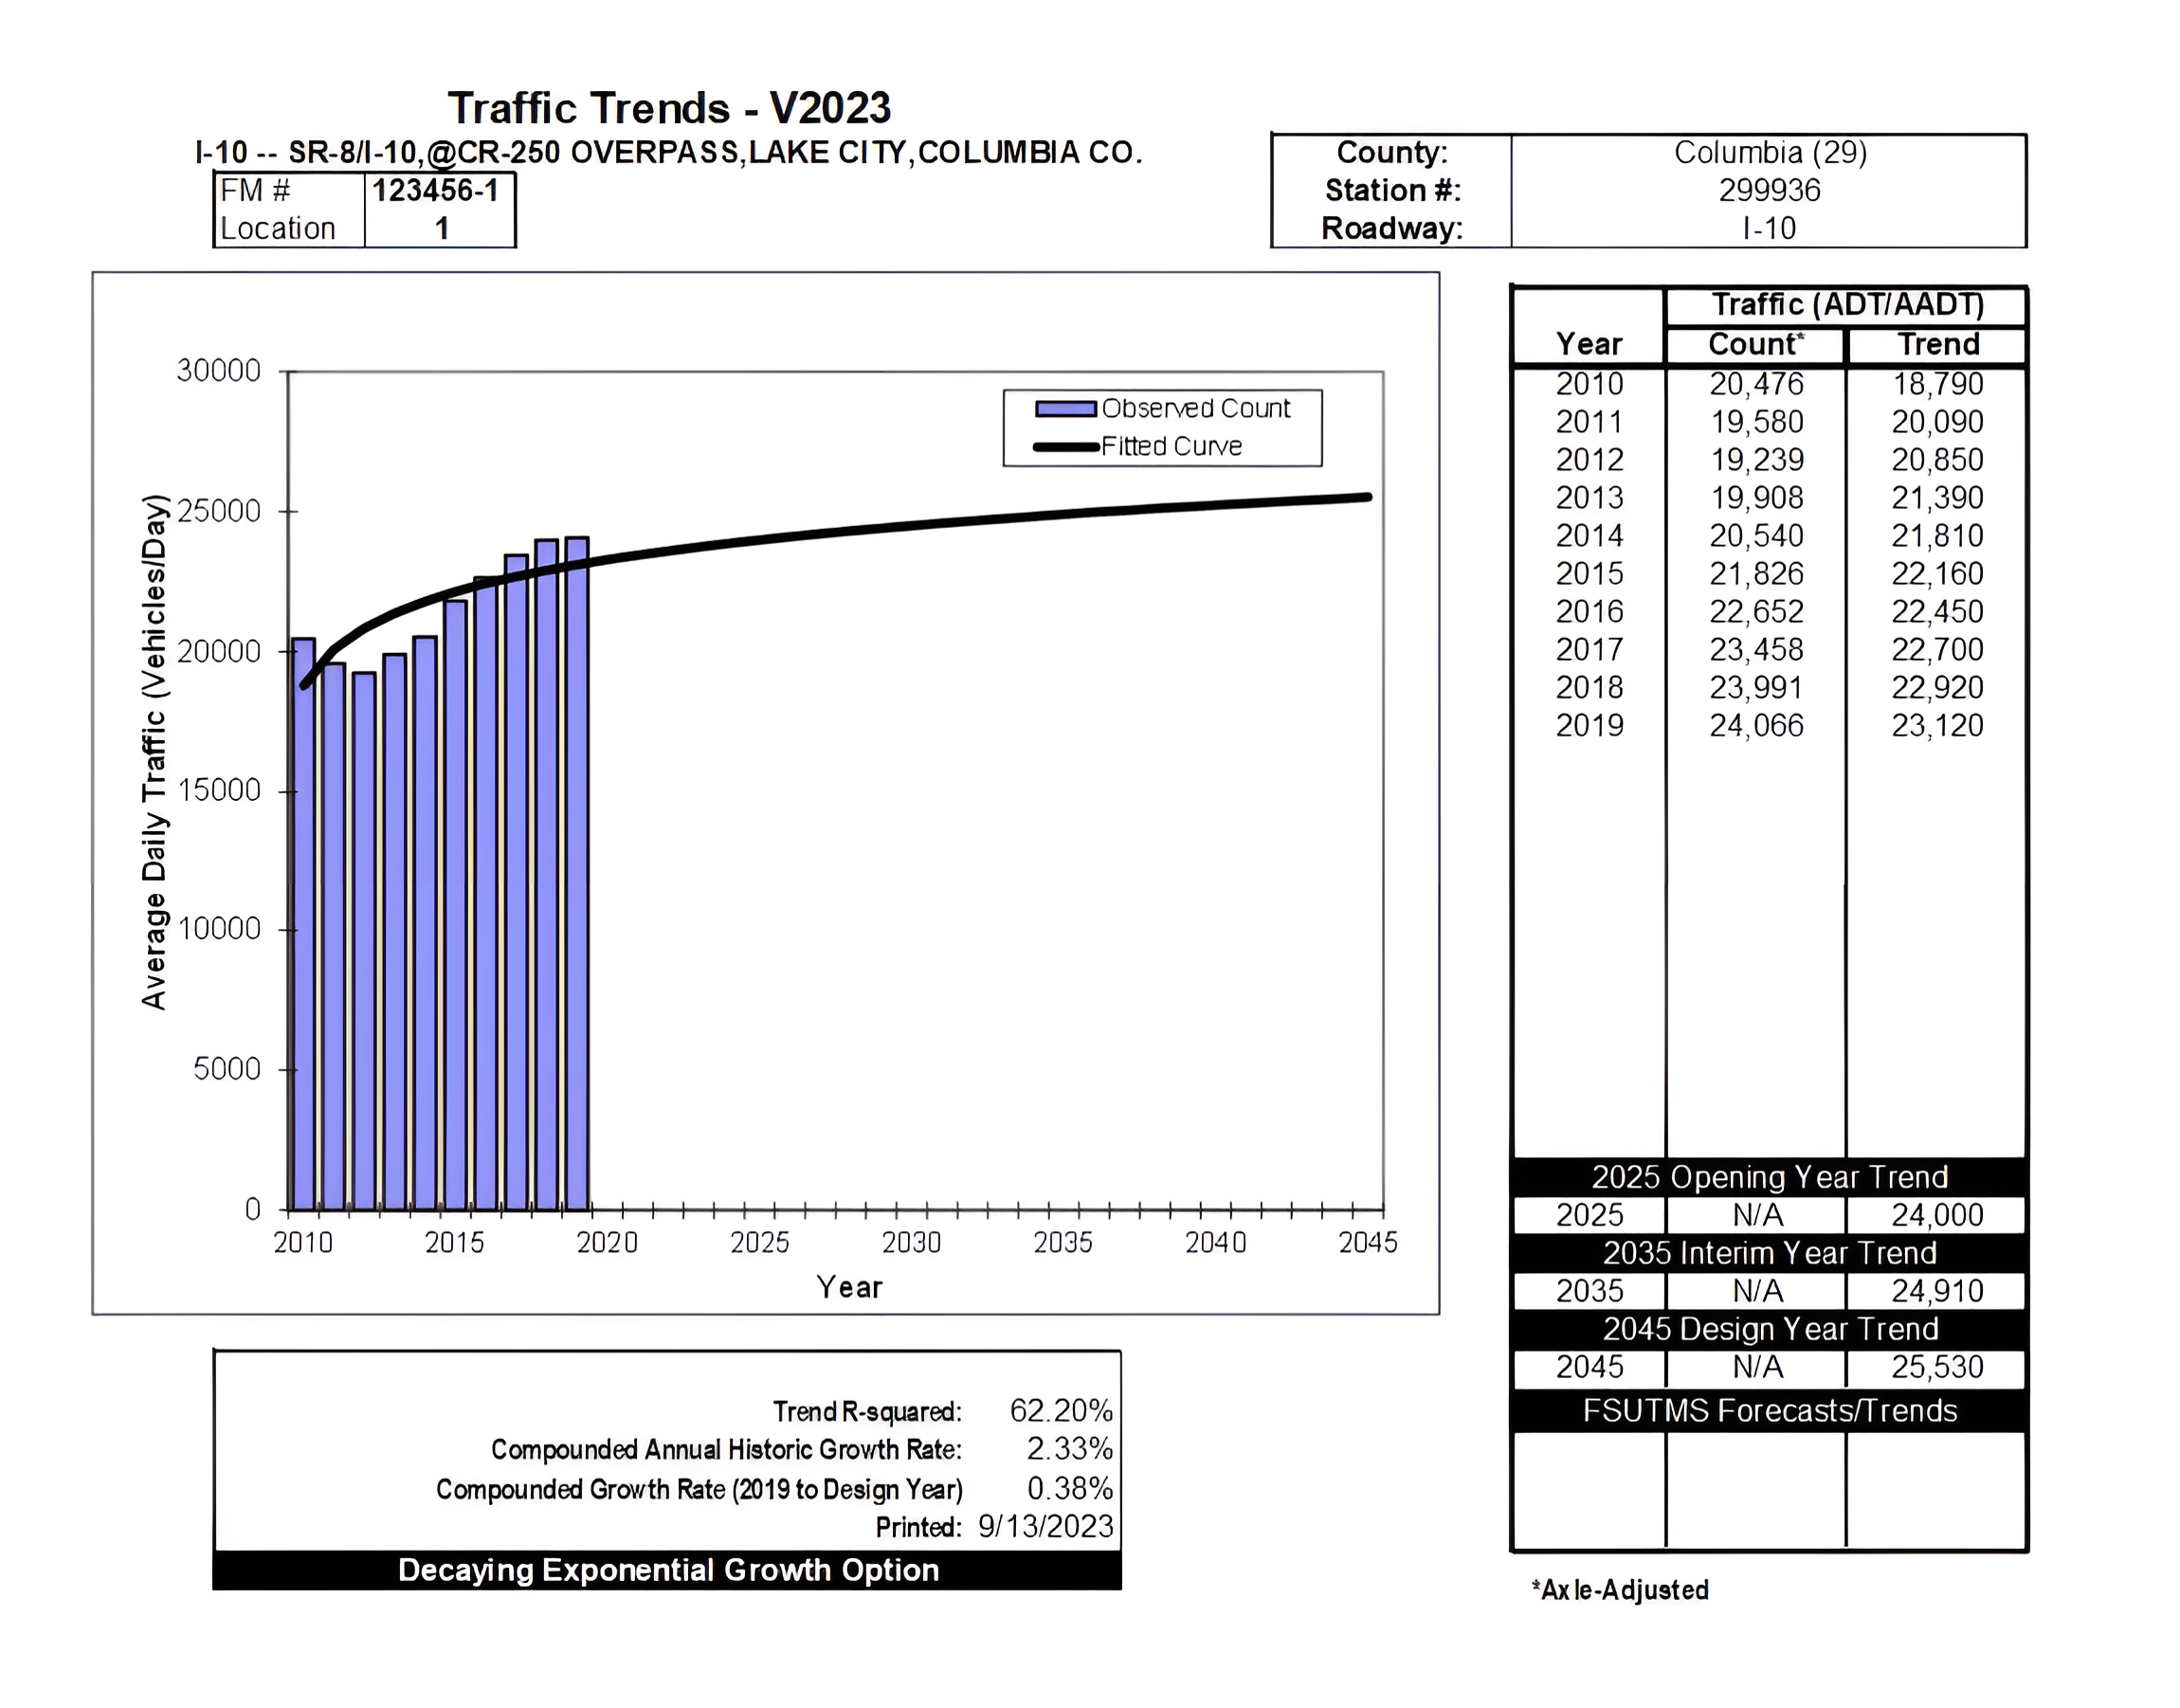
Figure 5-8 Trend Analysis Decaying Exponential Growth Pattern
Table 5-3 Historical Trend Analysis Summary
| Historical Trend Summary | |||||
| FDOT Site | Location | Year of Historical AADT | Historic Trend Analysis | ||
| Type | R Square | Annual Growth Rate | |||
| #299936 | 1-10 SR-8/1-10,@CR-250 OVERPASS, LAKE CITY, FL | 2010 to 2019 | Linear | 86.44% | 2.79% |
| Exponential | 86.05% | 2.49% | |||
| Decaying Exponential | 62.20% | 2.33% | |||
Step 3:
Review Traffic Projections for Reasonableness
According to FDOT's Population Projections from 2020 to 2045, the population of Columbia County is expected to increase from 69,698 in 2020 to 79,500 in 2045 (See Figure 5-9). This is an average of 0.56% in linear growth per year.
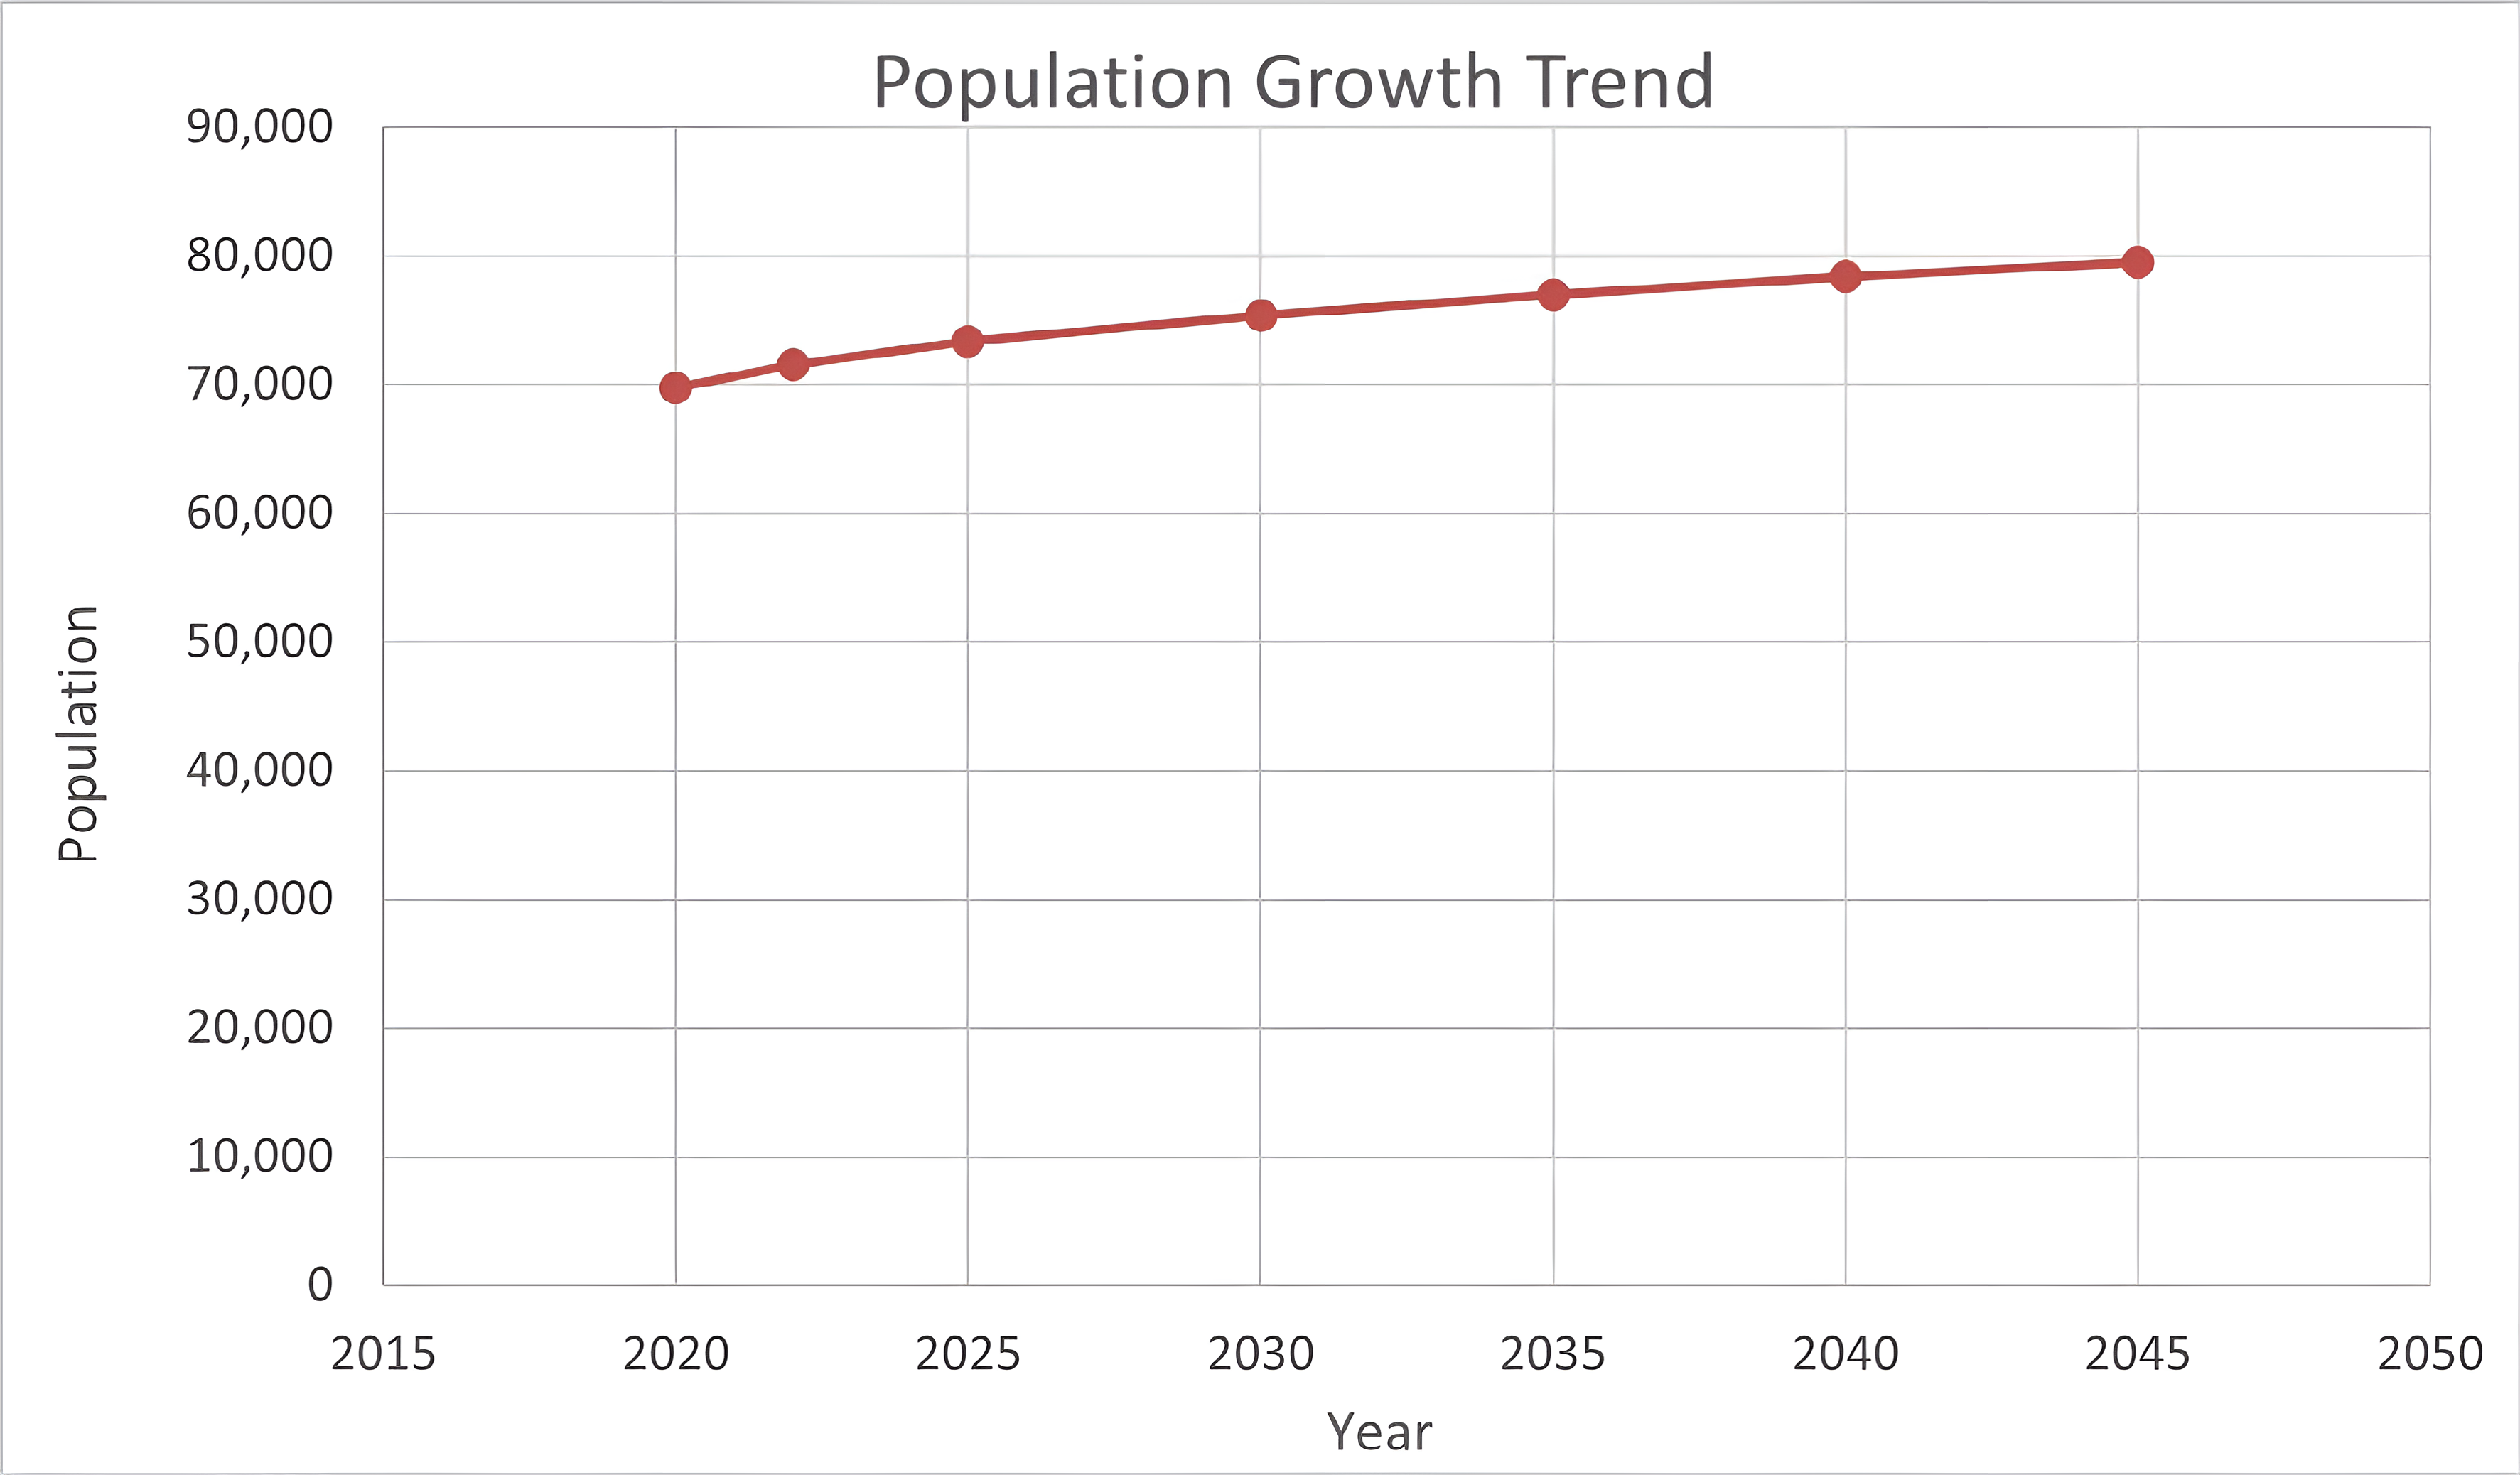
Figure 5-9 Population Growth Trends
A comparison was then made to historical population data. Using BEBR population estimates, Columbia County’s population increased from 67,489 in 2013 to 71,525 in 2022. This was a 6.0% increase over a 10-year period, or an average of 0.60% in linear growth per year. By comparison, traffic increased from 20,476 in 2010 to 24,466 in 2019. This is a 17.5 % linear increase over a 10-year period, or an average of 1.75% in linear growth year. Therefore, it is apparent that the trend forecast showing future traffic increasing at a rate higher than the rate of population growth is consistent with the past trend over the last 10 years. It should be noted that population growth is typically used for reasonableness checks unless traffic growth data is unavailable or deemed unreasonable.