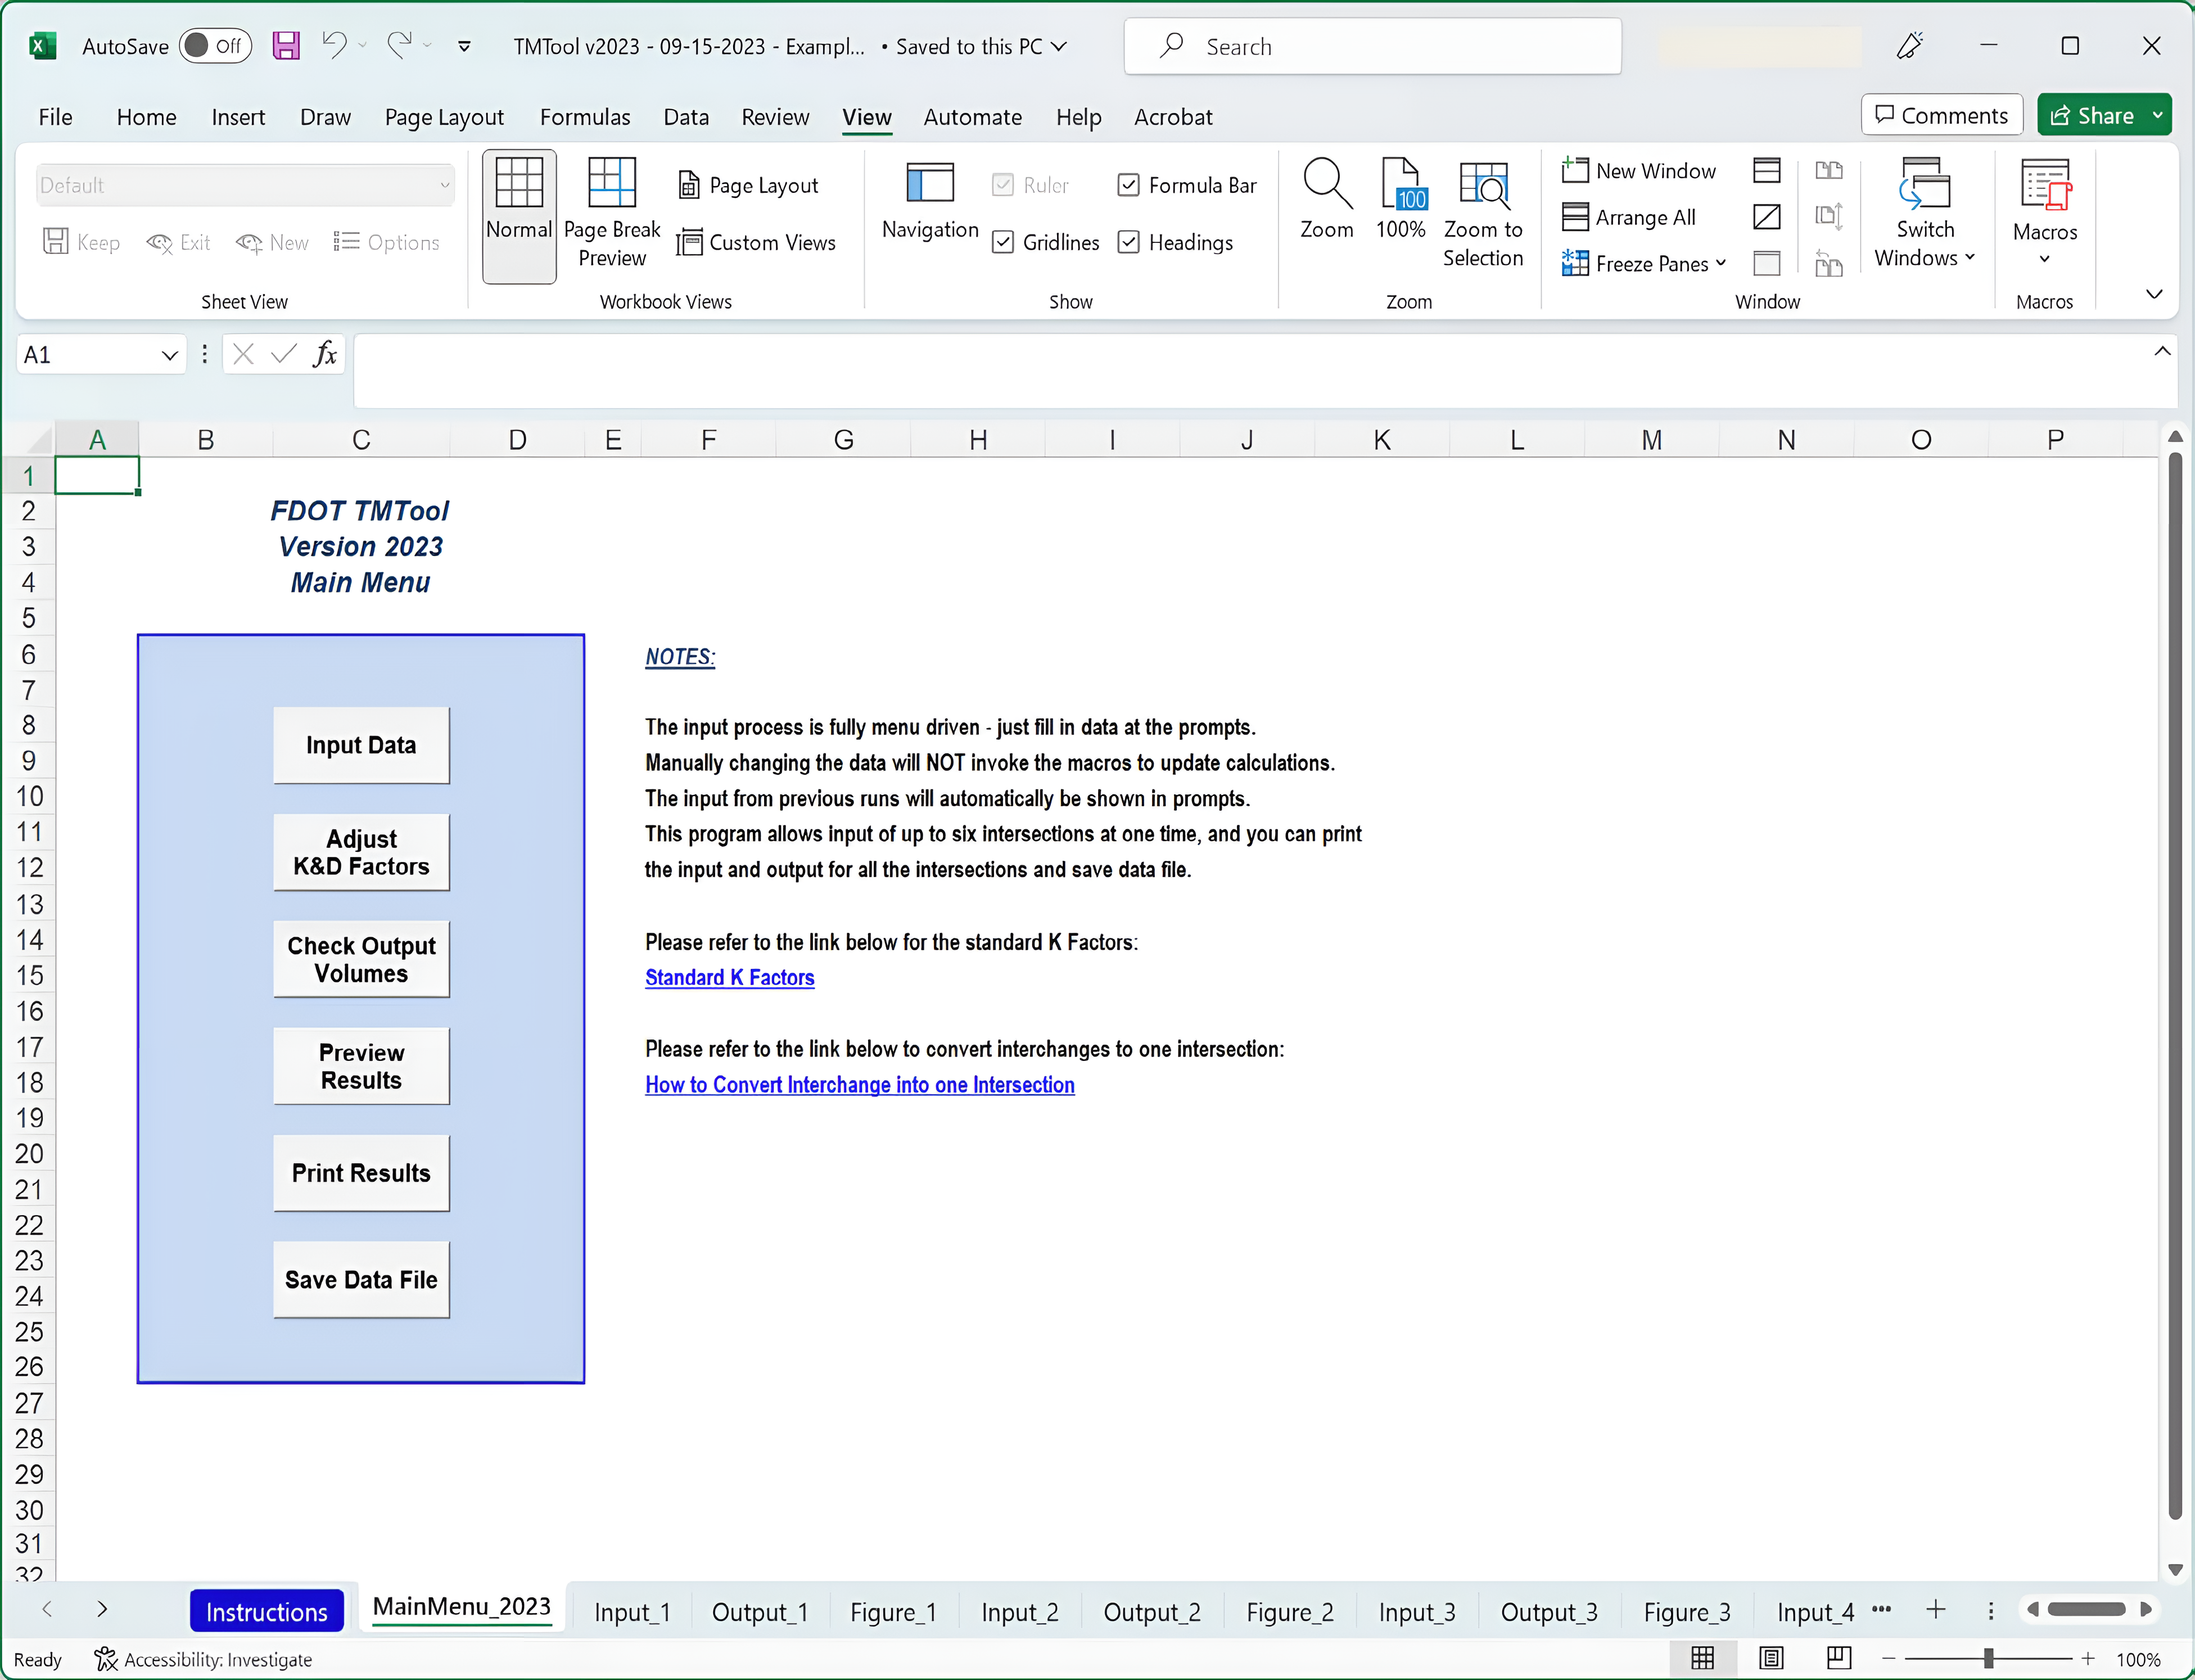
TMTool was initially developed by FDOT District 4 to estimate future turning movement volumes. Compared to TURNS5, TMTool has the capability of estimating turning movement volumes for multiple time periods at the same time, and it also handles special intersection configurations such as T-Intersections. In 2023, FDOT Central Office updated TMTool (TMTool v2023) to allow up to five (5) intersections to be processed simultaneously. It also provides a separate screen to allow users to enter the selected K Factors based on the new K-Factor Ranges. More detailed instructions are provided in this section to guide the users to work through the different tabs in the spreadsheet. Output functions are also enhanced to provide graphic representation of intersection turning movement volumes for different time periods and different analysis years to facilitate corridor-level traffic volume smoothing and balancing. The new version also provides examples on how to use TMTool to estimate turning movement volumes at an interchange. Figure 7-8 shows the main menu of TMTool v2023.
TMTool utilizes base year and projected future year AADT volumes together with existing year turning movement counts to calculate the future turning movement volumes. It also includes error checking mechanisms to verify if forecasted volumes show negative growth, as is the case with many iterative procedures. The TMTool can be used for both existing and planned intersections. The following sections describe menu items and the general process to develop future turning movement volumes using TMTool v2023.
TMTool v2023 “Input Data” Menu
The “Input Data” Menu allows the user to provide general project information and specific information for all study intersections. The project information includes roadway section number, FM number, project limits, person prepared analysis, file number, and date. The information is optional and only for project identification purposes. Enter existing year, opening year, interim year, and design year. The existing year is required. Opening year, interim year, and design year are required only if the traffic forecast is needed for these future years. Figure 7-9 shows an example of the project information input screen.
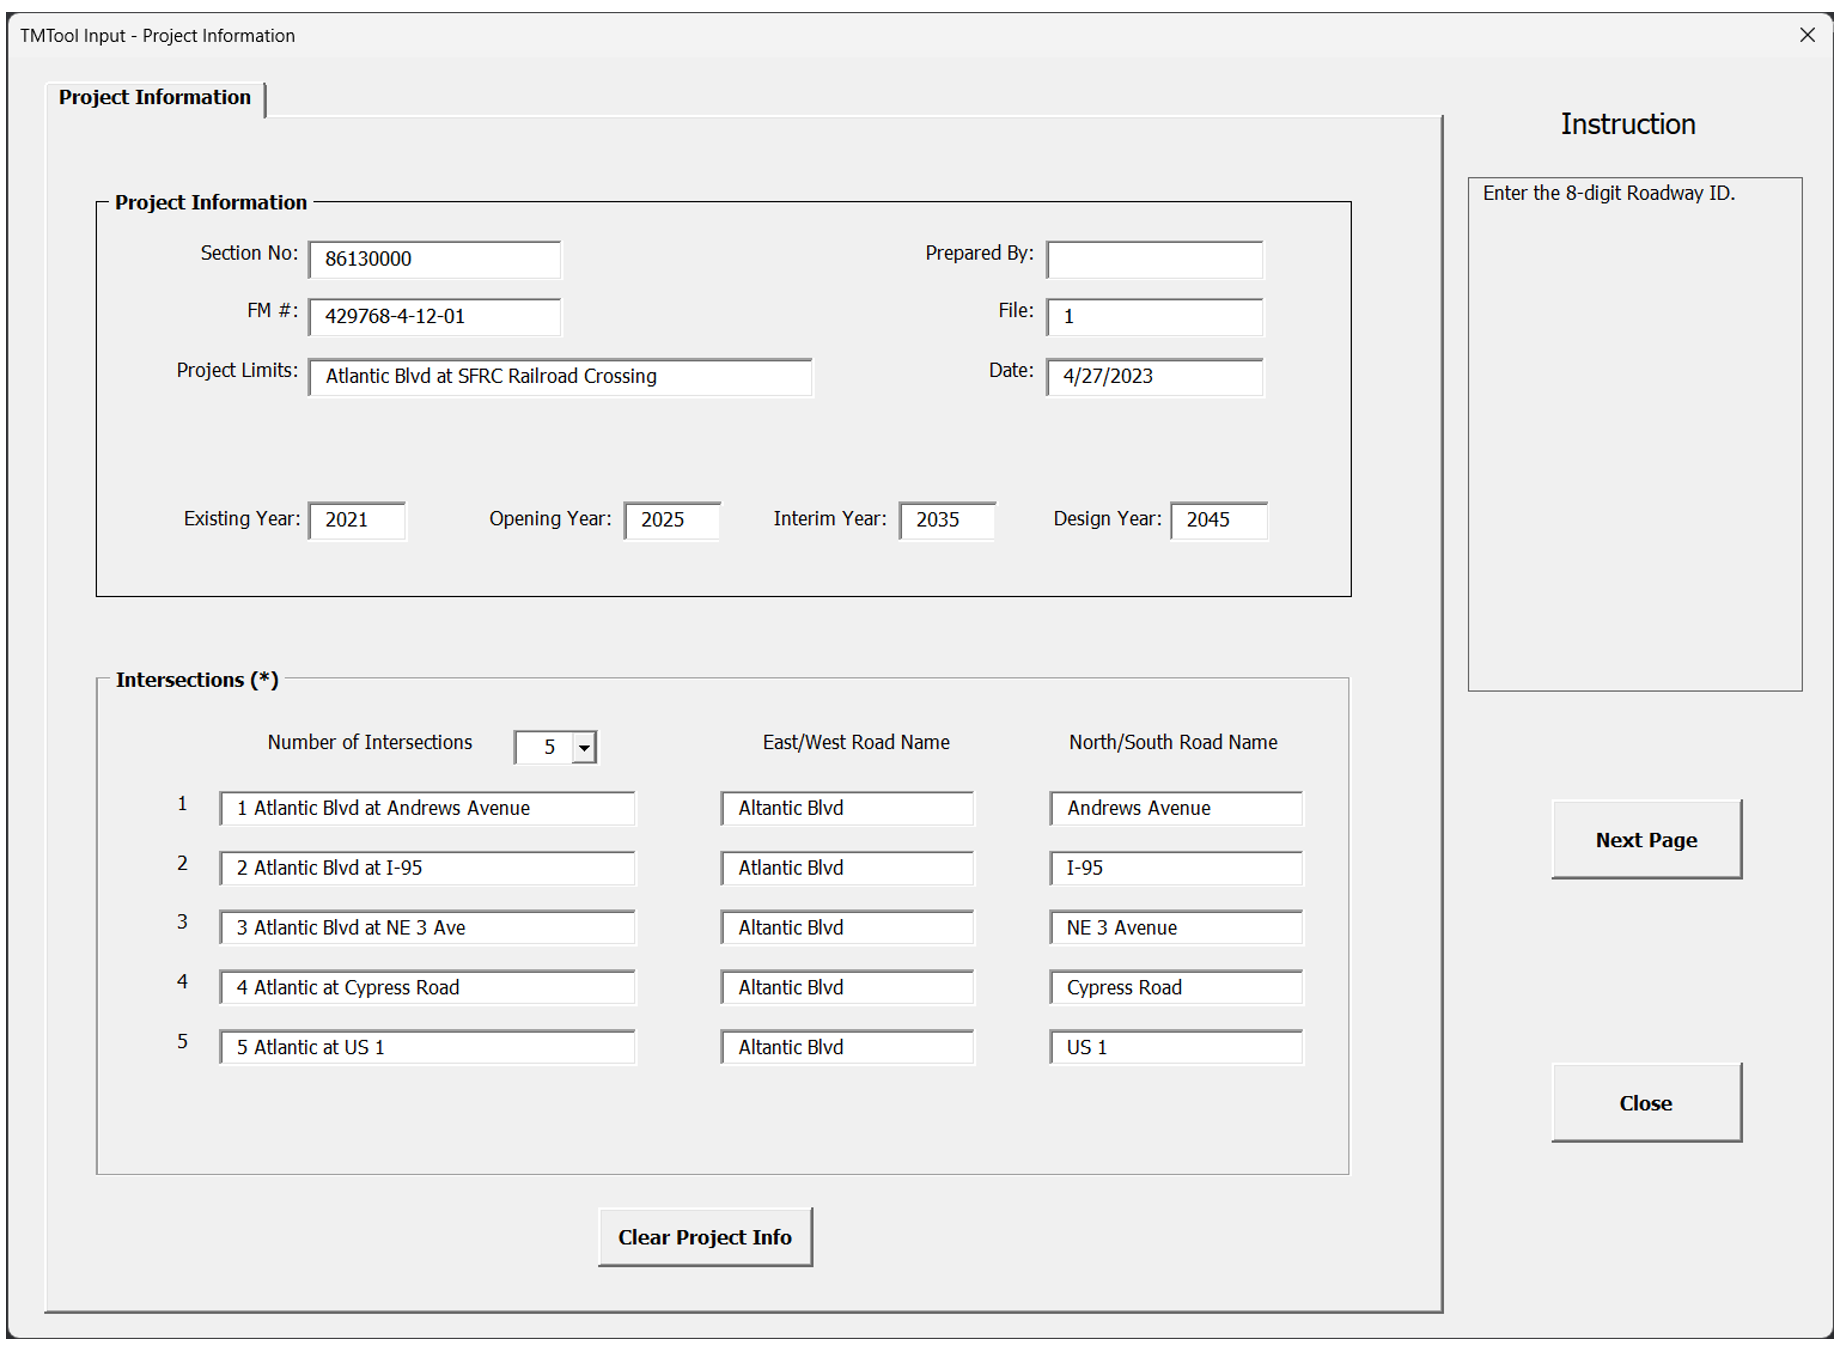
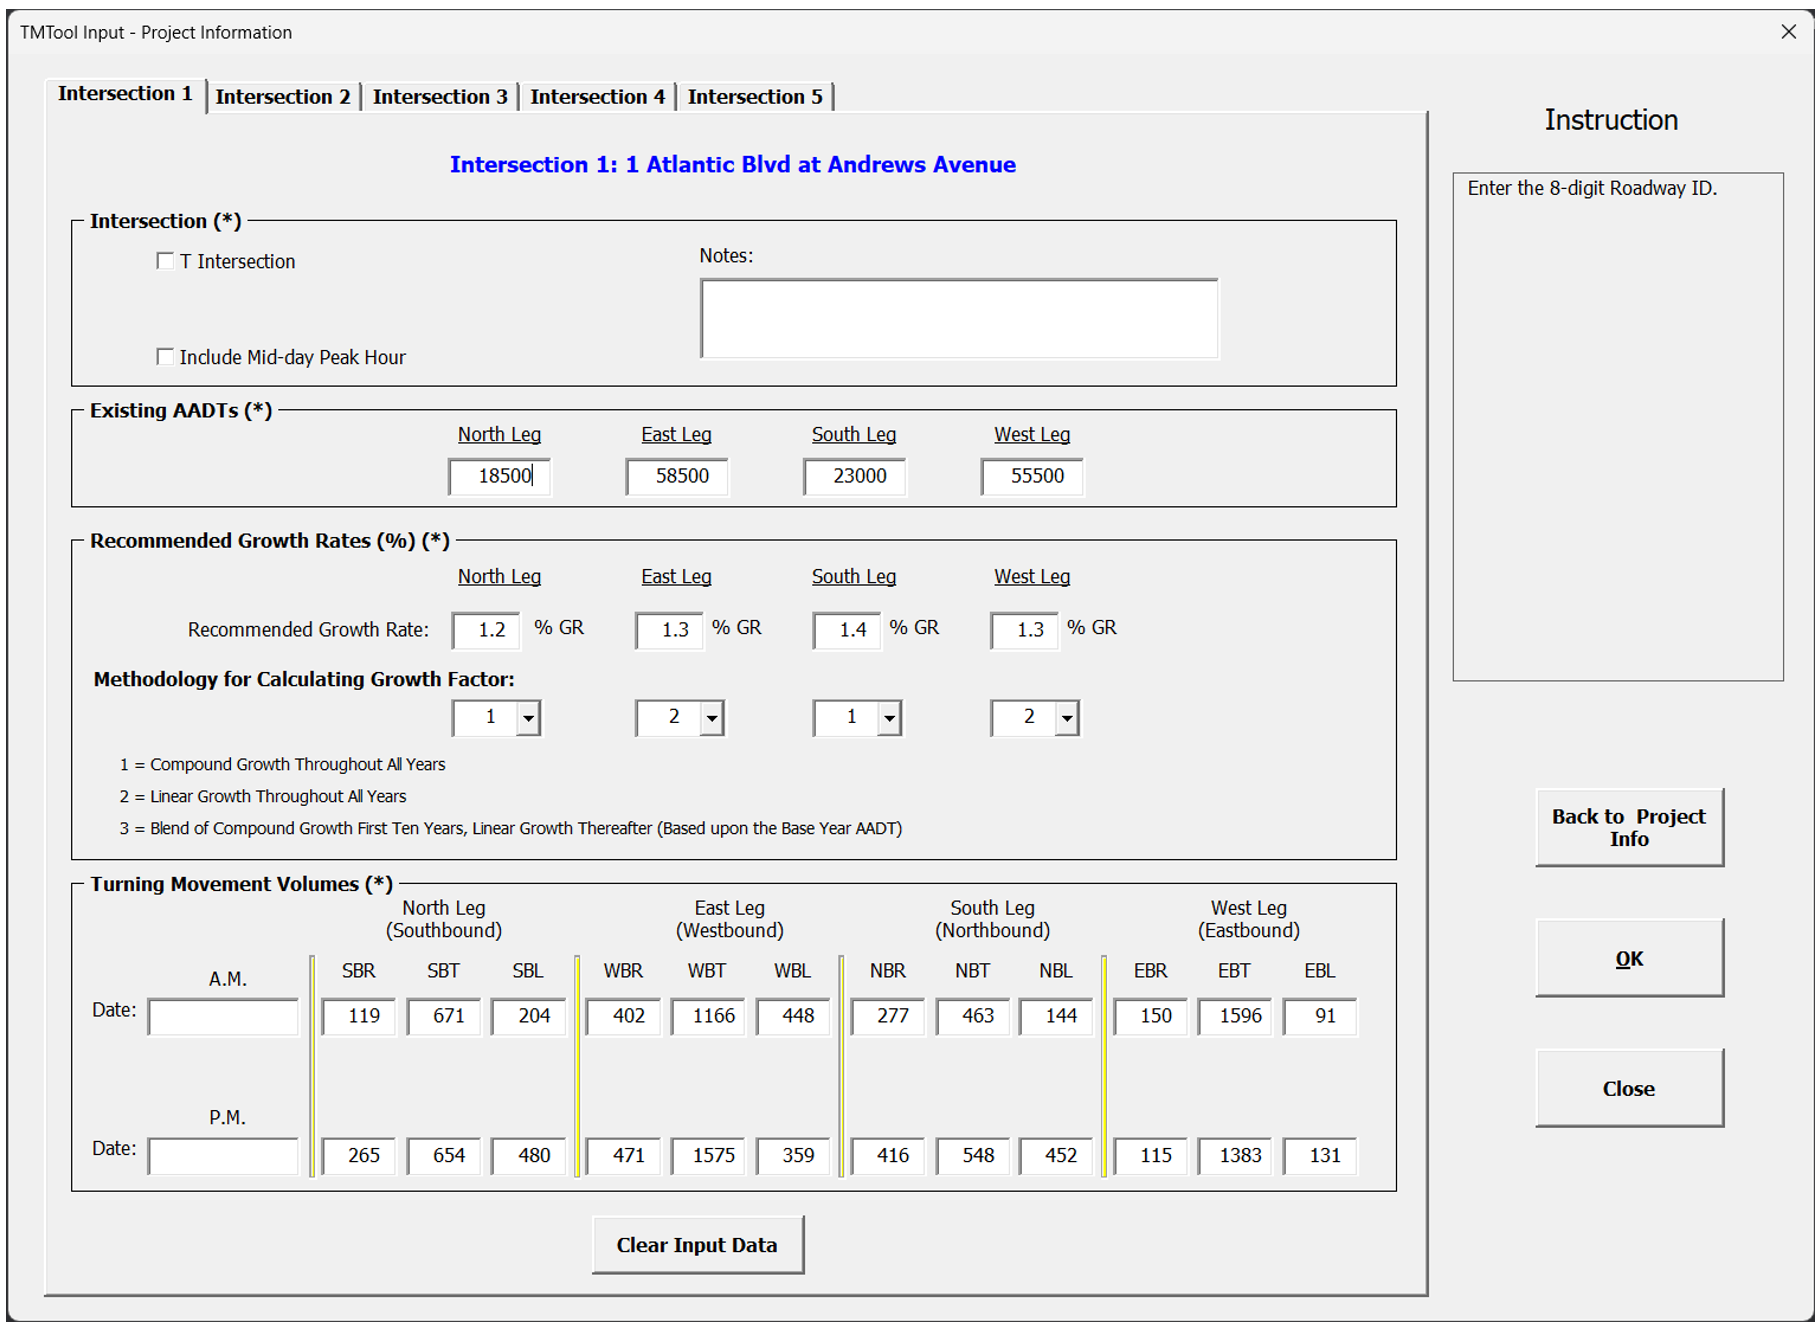
After the project information is entered, the user can move on to the “Intersections” section to provide information for the study intersections. First, click on the drop-down menu “Number of Intersections” to specify how many intersections will be analyzed. Up to six (6) intersections can be analyzed at one time. The user then needs to provide a name for each intersection and identify the names of two crossing streets of the intersection. The user will continue to provide traffic-related information for all study intersections by clicking the “Next Page” button. The information includes T-Intersection, Mid-day peak hour, existing year AADT, recommended growth rates, methodology for calculating growth factor, and existing turning movement volumes. Click on “Intersection #” (# represents intersection number) tabs on the top of the screen to enter information for different intersections. Figure 7-10 shows an example of the intersection information input screen.
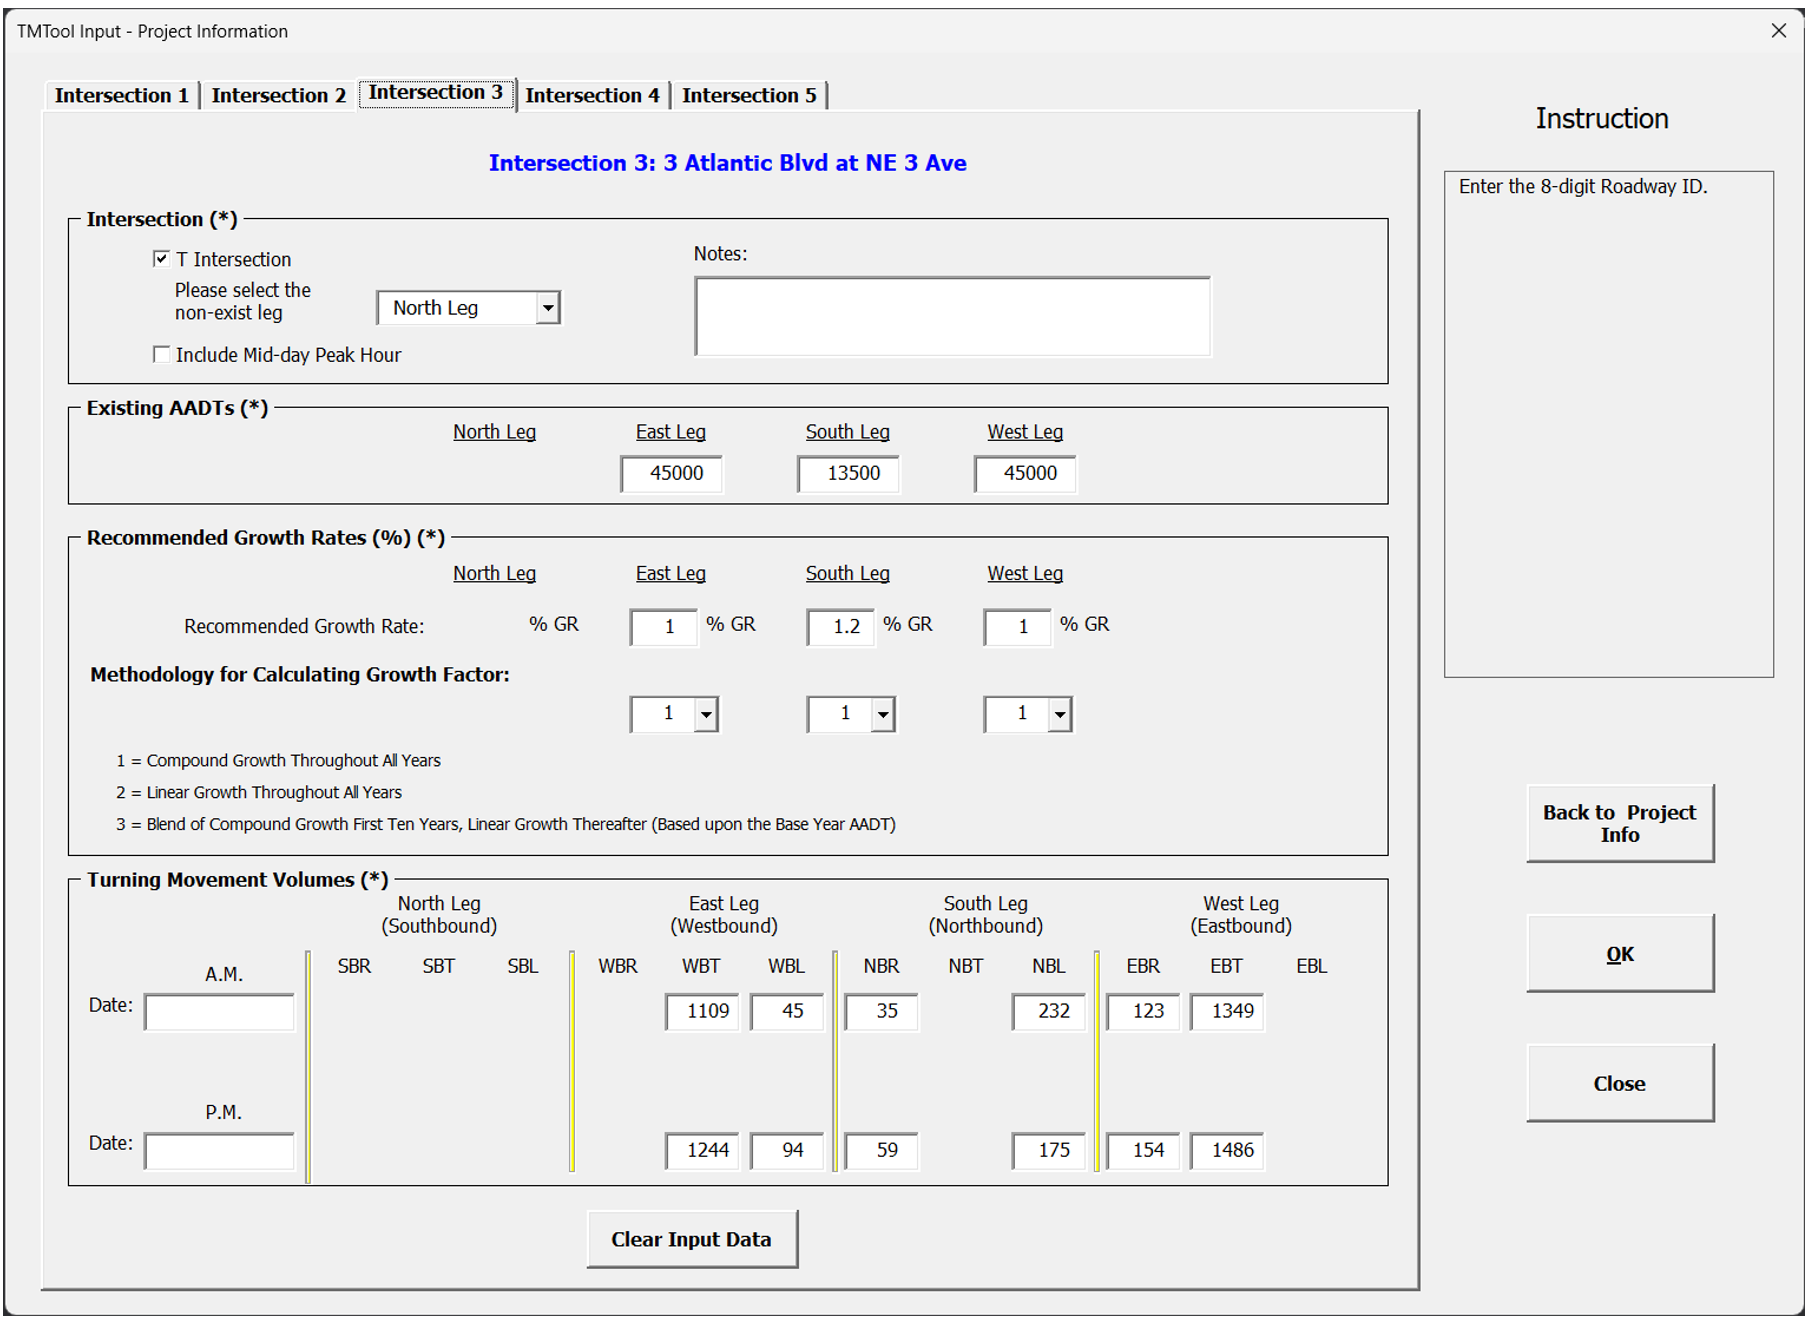
TMTool has the capability of estimating turning movement volumes for T-Intersections and for Mid-Day peak hour. Check the “T Intersection” or “Include Mid-day Peak Hour” option box to activate this option. Figure 7-11 shows an example of the T-Intersection information input screen. Click on the “Back to Project Info” button if the user wishes to change the Project Information on the previous screen. Click on the “Clear Input Data” to erase all the data entered in this screen and re-enter the information. Click the Close button to close the current screen.
TMTool v2023 “Adjust K and D Factors” Menu
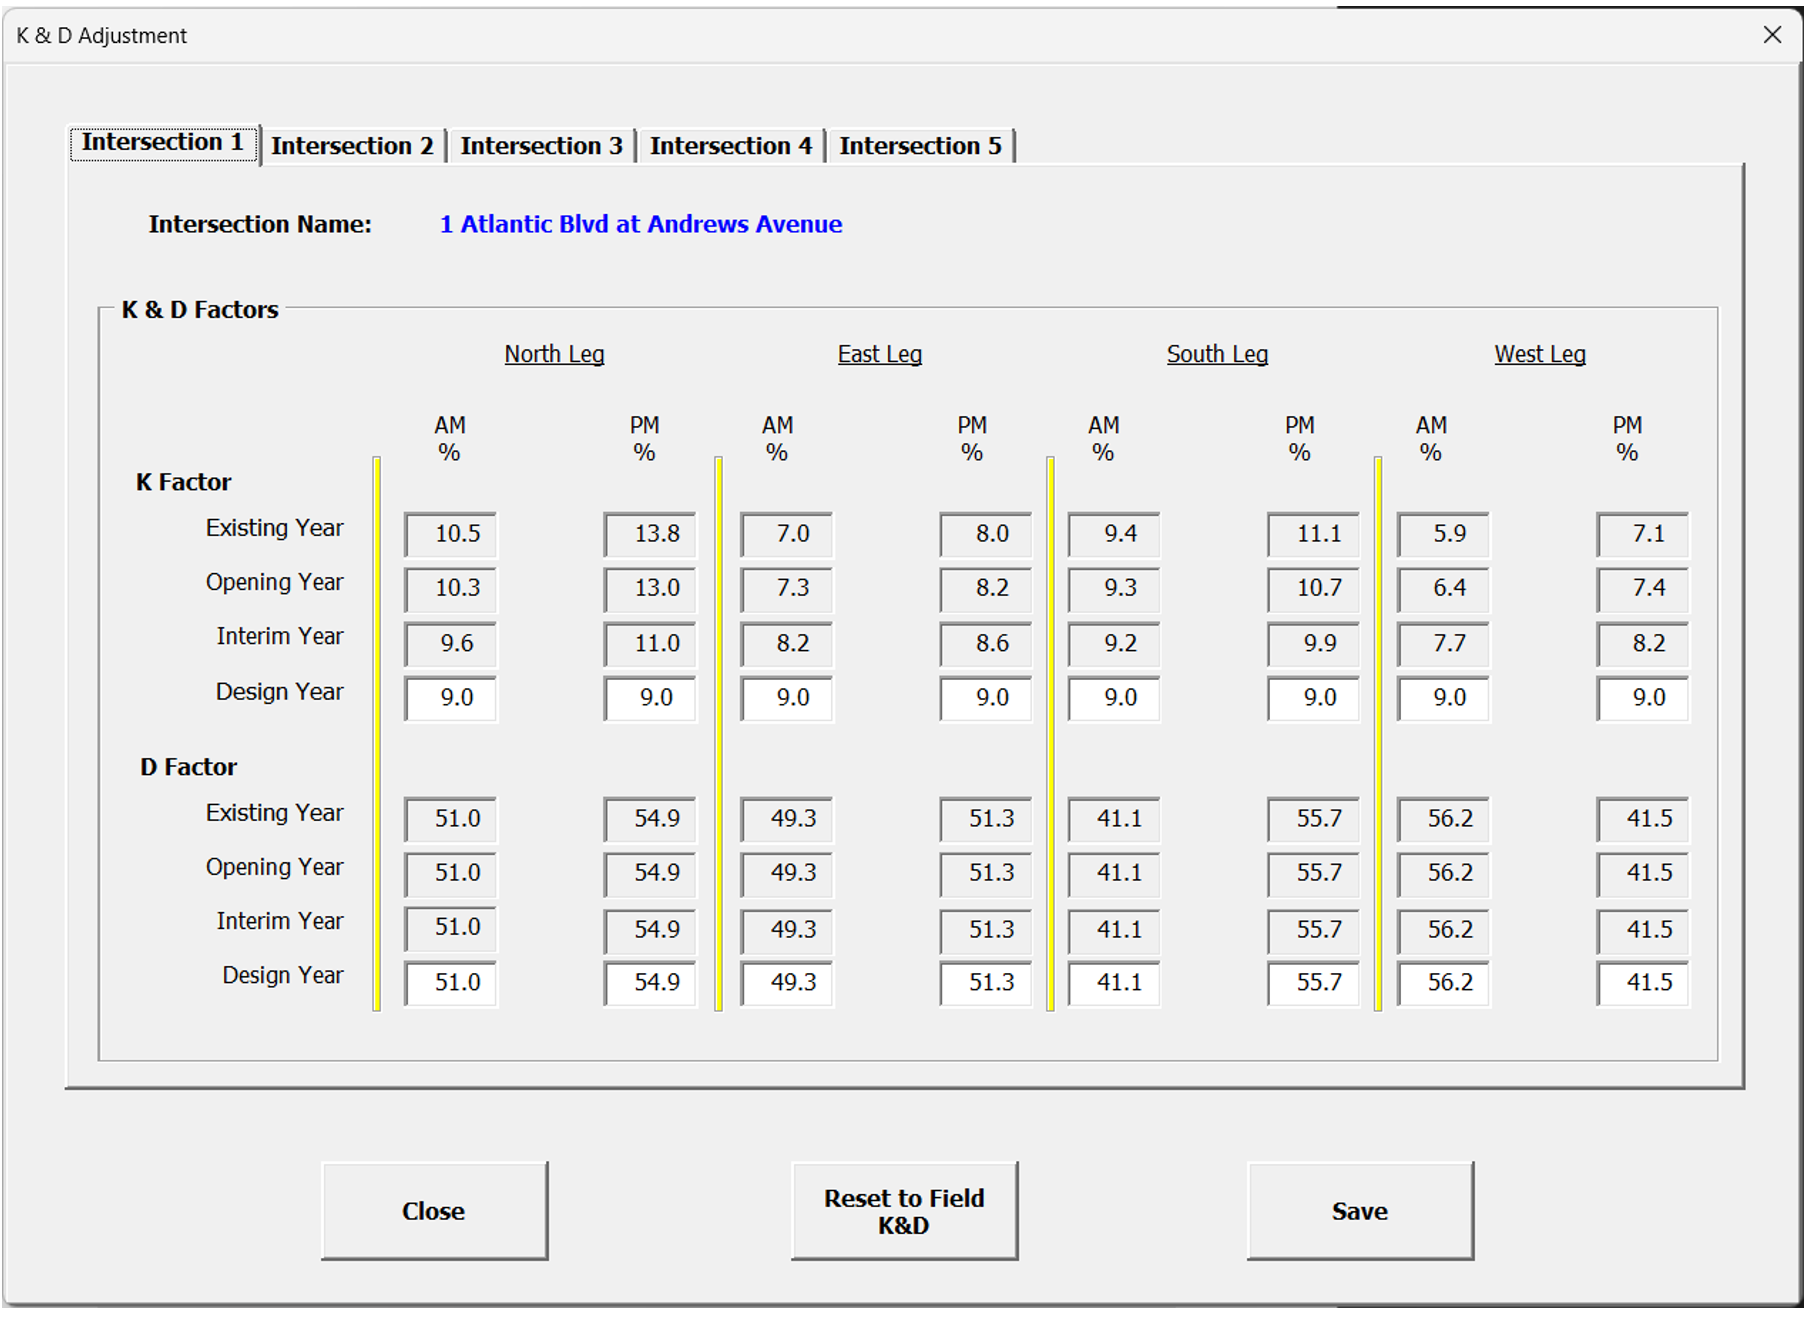
The next step is to provide acceptable K and D factors for different analysis years. K and D factors for the base year are calculated from the existing year AADT and turning movement counts. The future K and D factors need to be adjusted for future years based on the K and D factors range specified in Chapter 2.5. It should be noted that the roadway context classification for the intersection location needs to be determined in order to select a single K factor within the range. K and D factors for interim years are calculated by linear interpolation between the base year and design year values but can be modified when justified. Prior approval from the District Planning Office or Project Manager is required. Click on the “Reset to Field K&D” button to reset K and D factors to the values based on field data. Figure 7-12 shows an example of the K & D Adjustment input screen. In this example, the context classification is C3C – Suburban Commercial. Therefore, a single K factor of 9.0 within the range of 7.5 – 9.5 is selected. The D factors remain unchanged since they are within the range for urban arterial. If the K and D factors for the opening year and interim year for an intersection need to be changed, please go to the corresponding intersection tab (“Intersection_#”) and make the changes.
TMTool v2023 “Check Output Volume” Menu
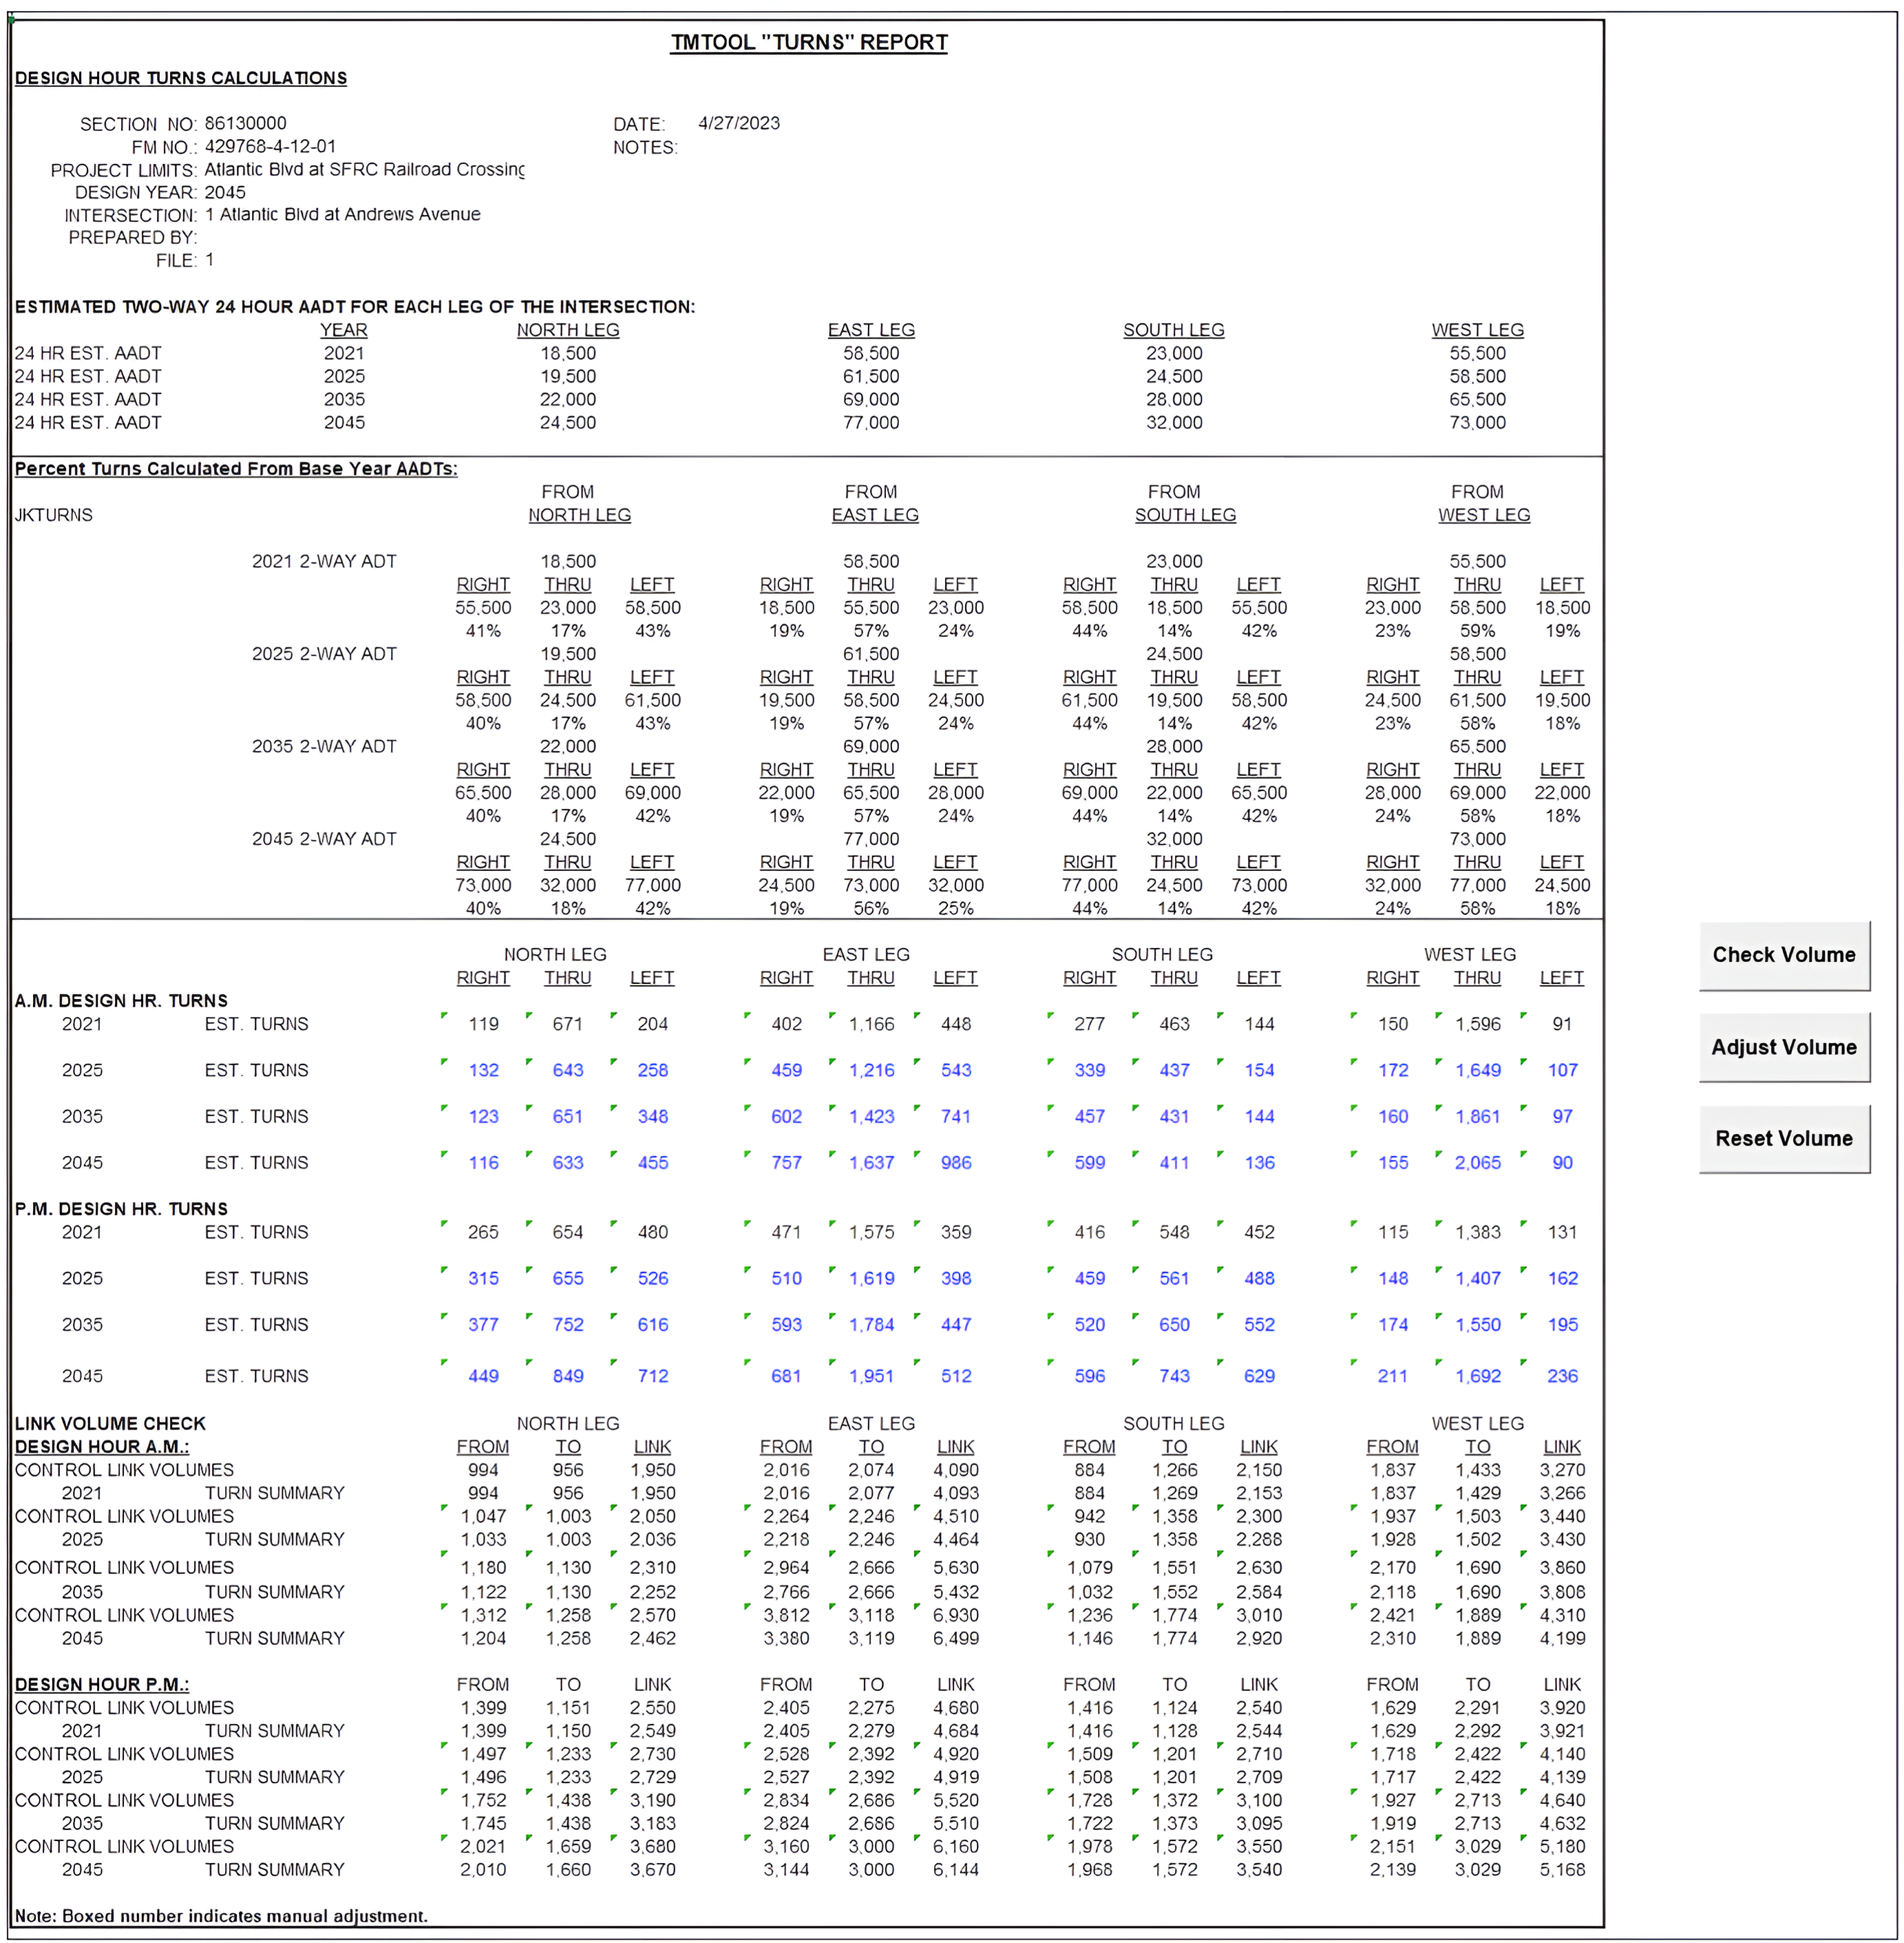
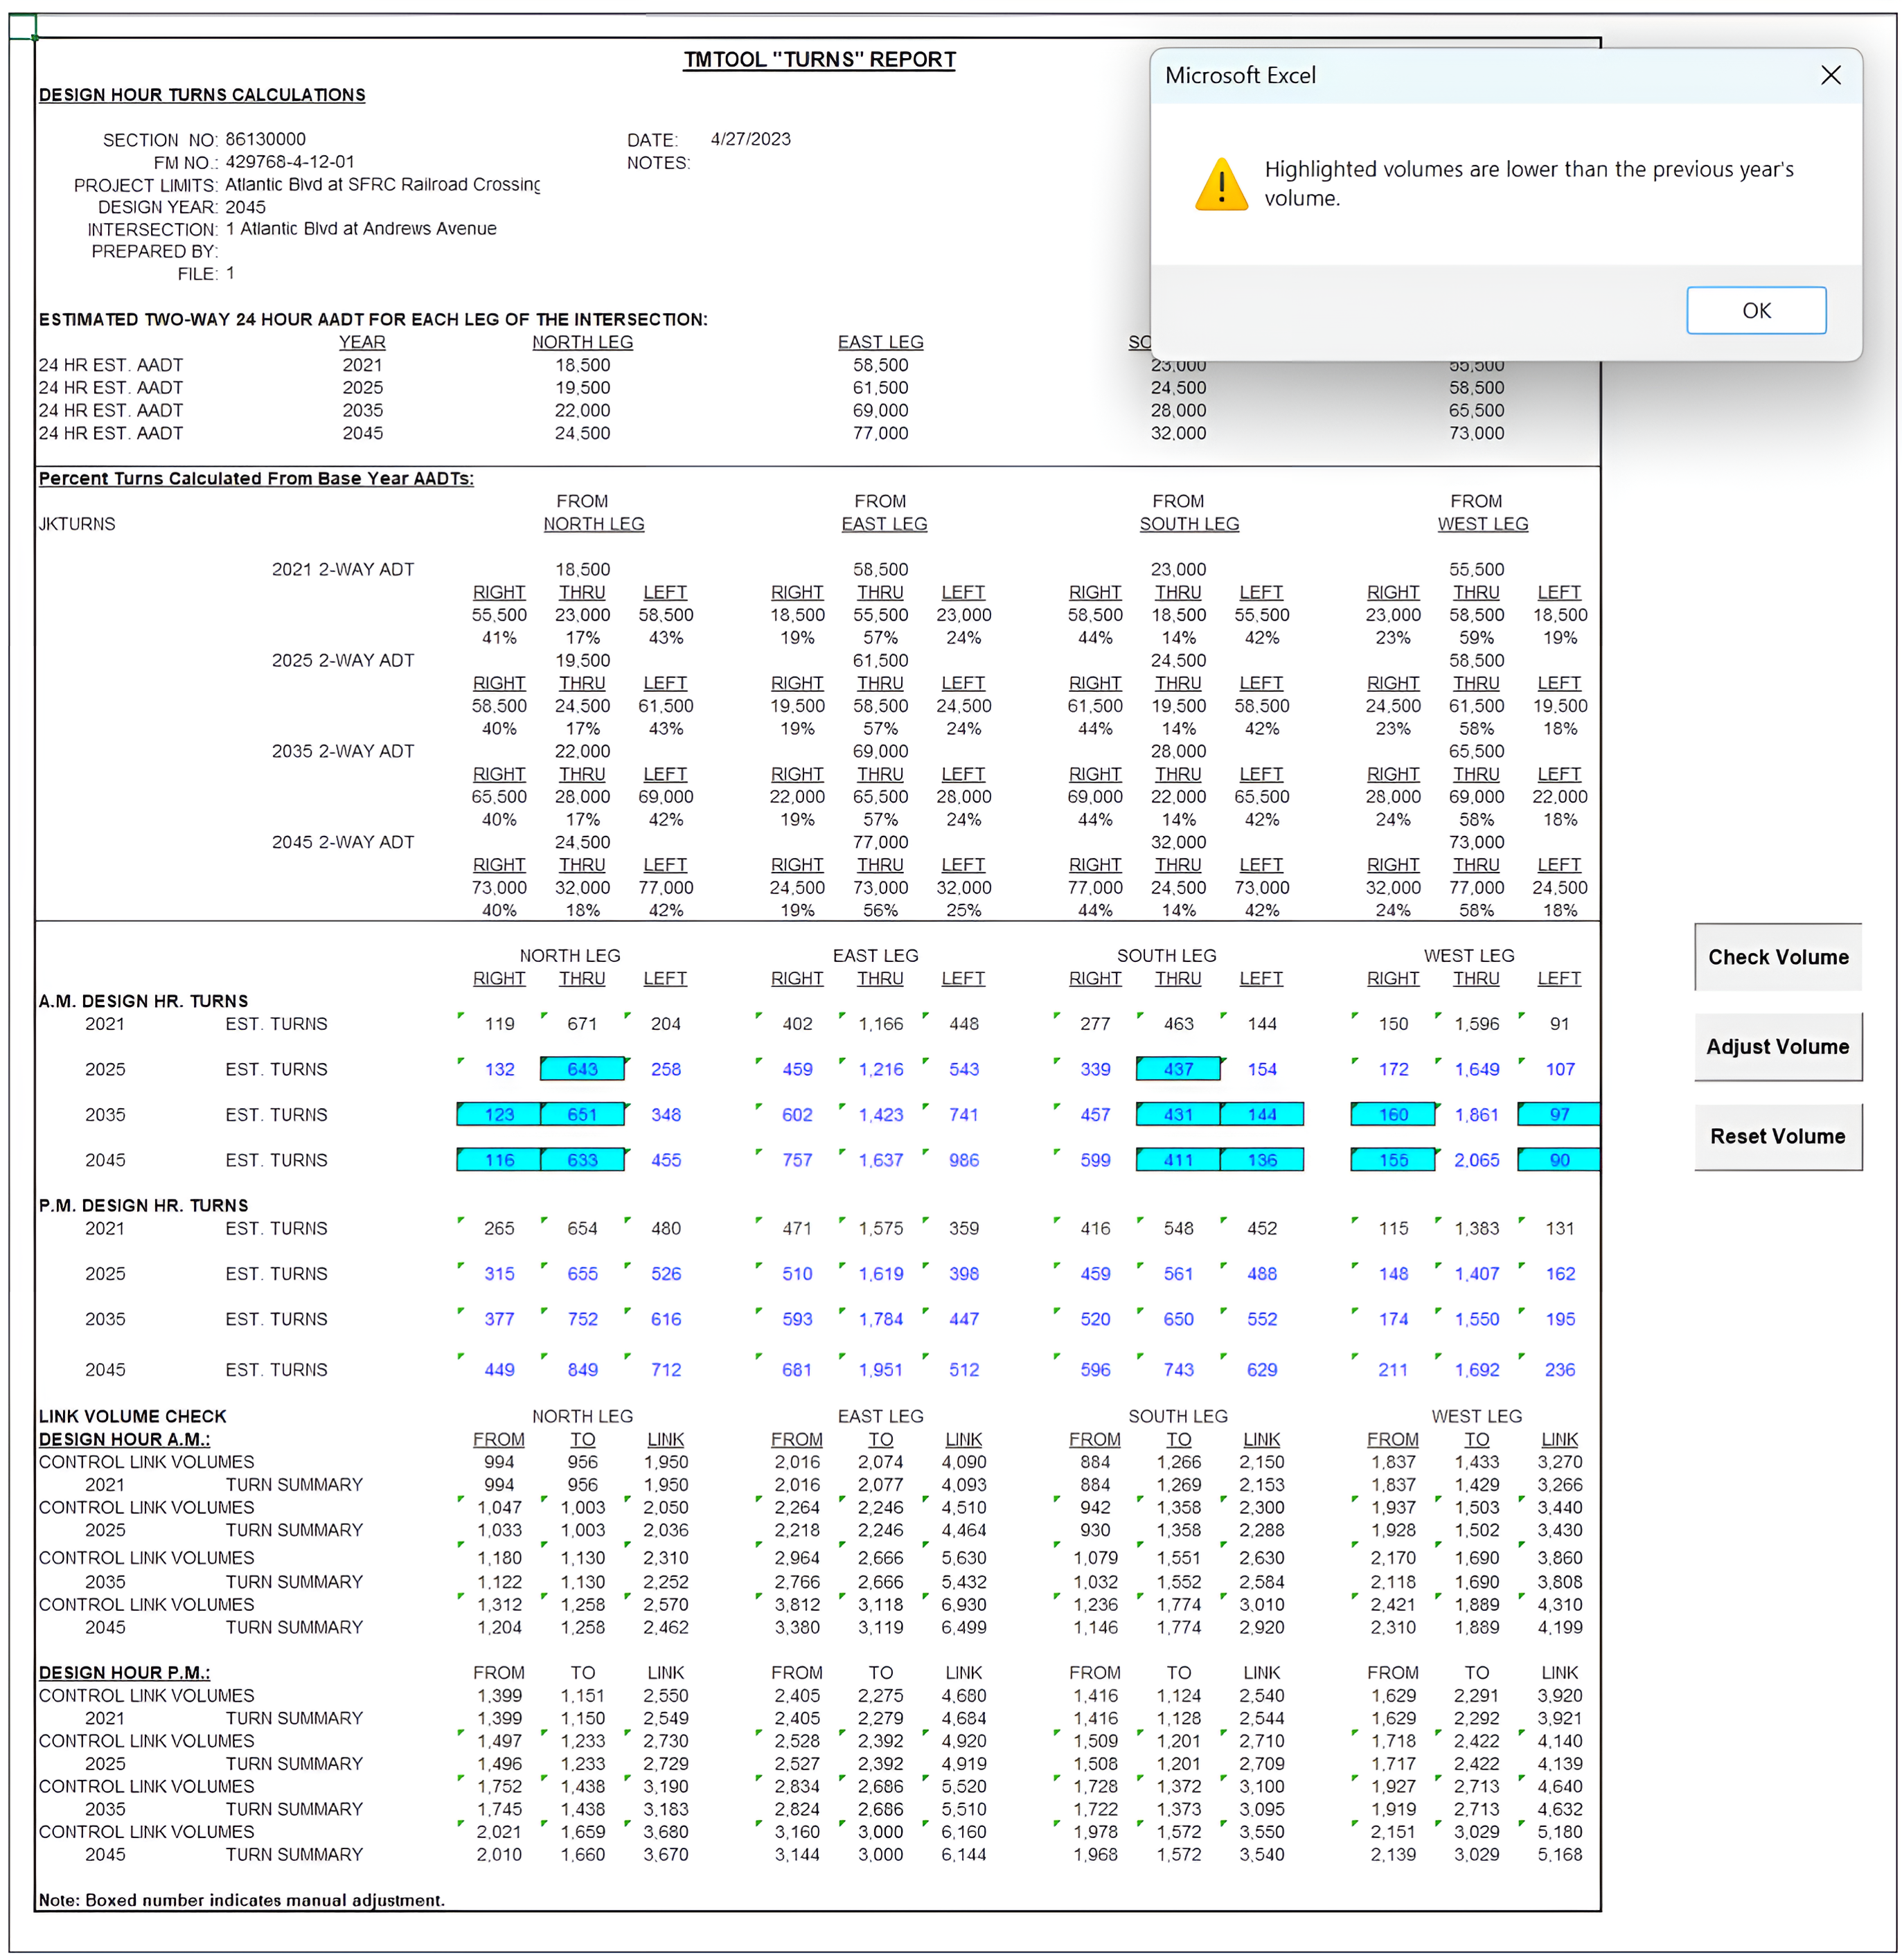
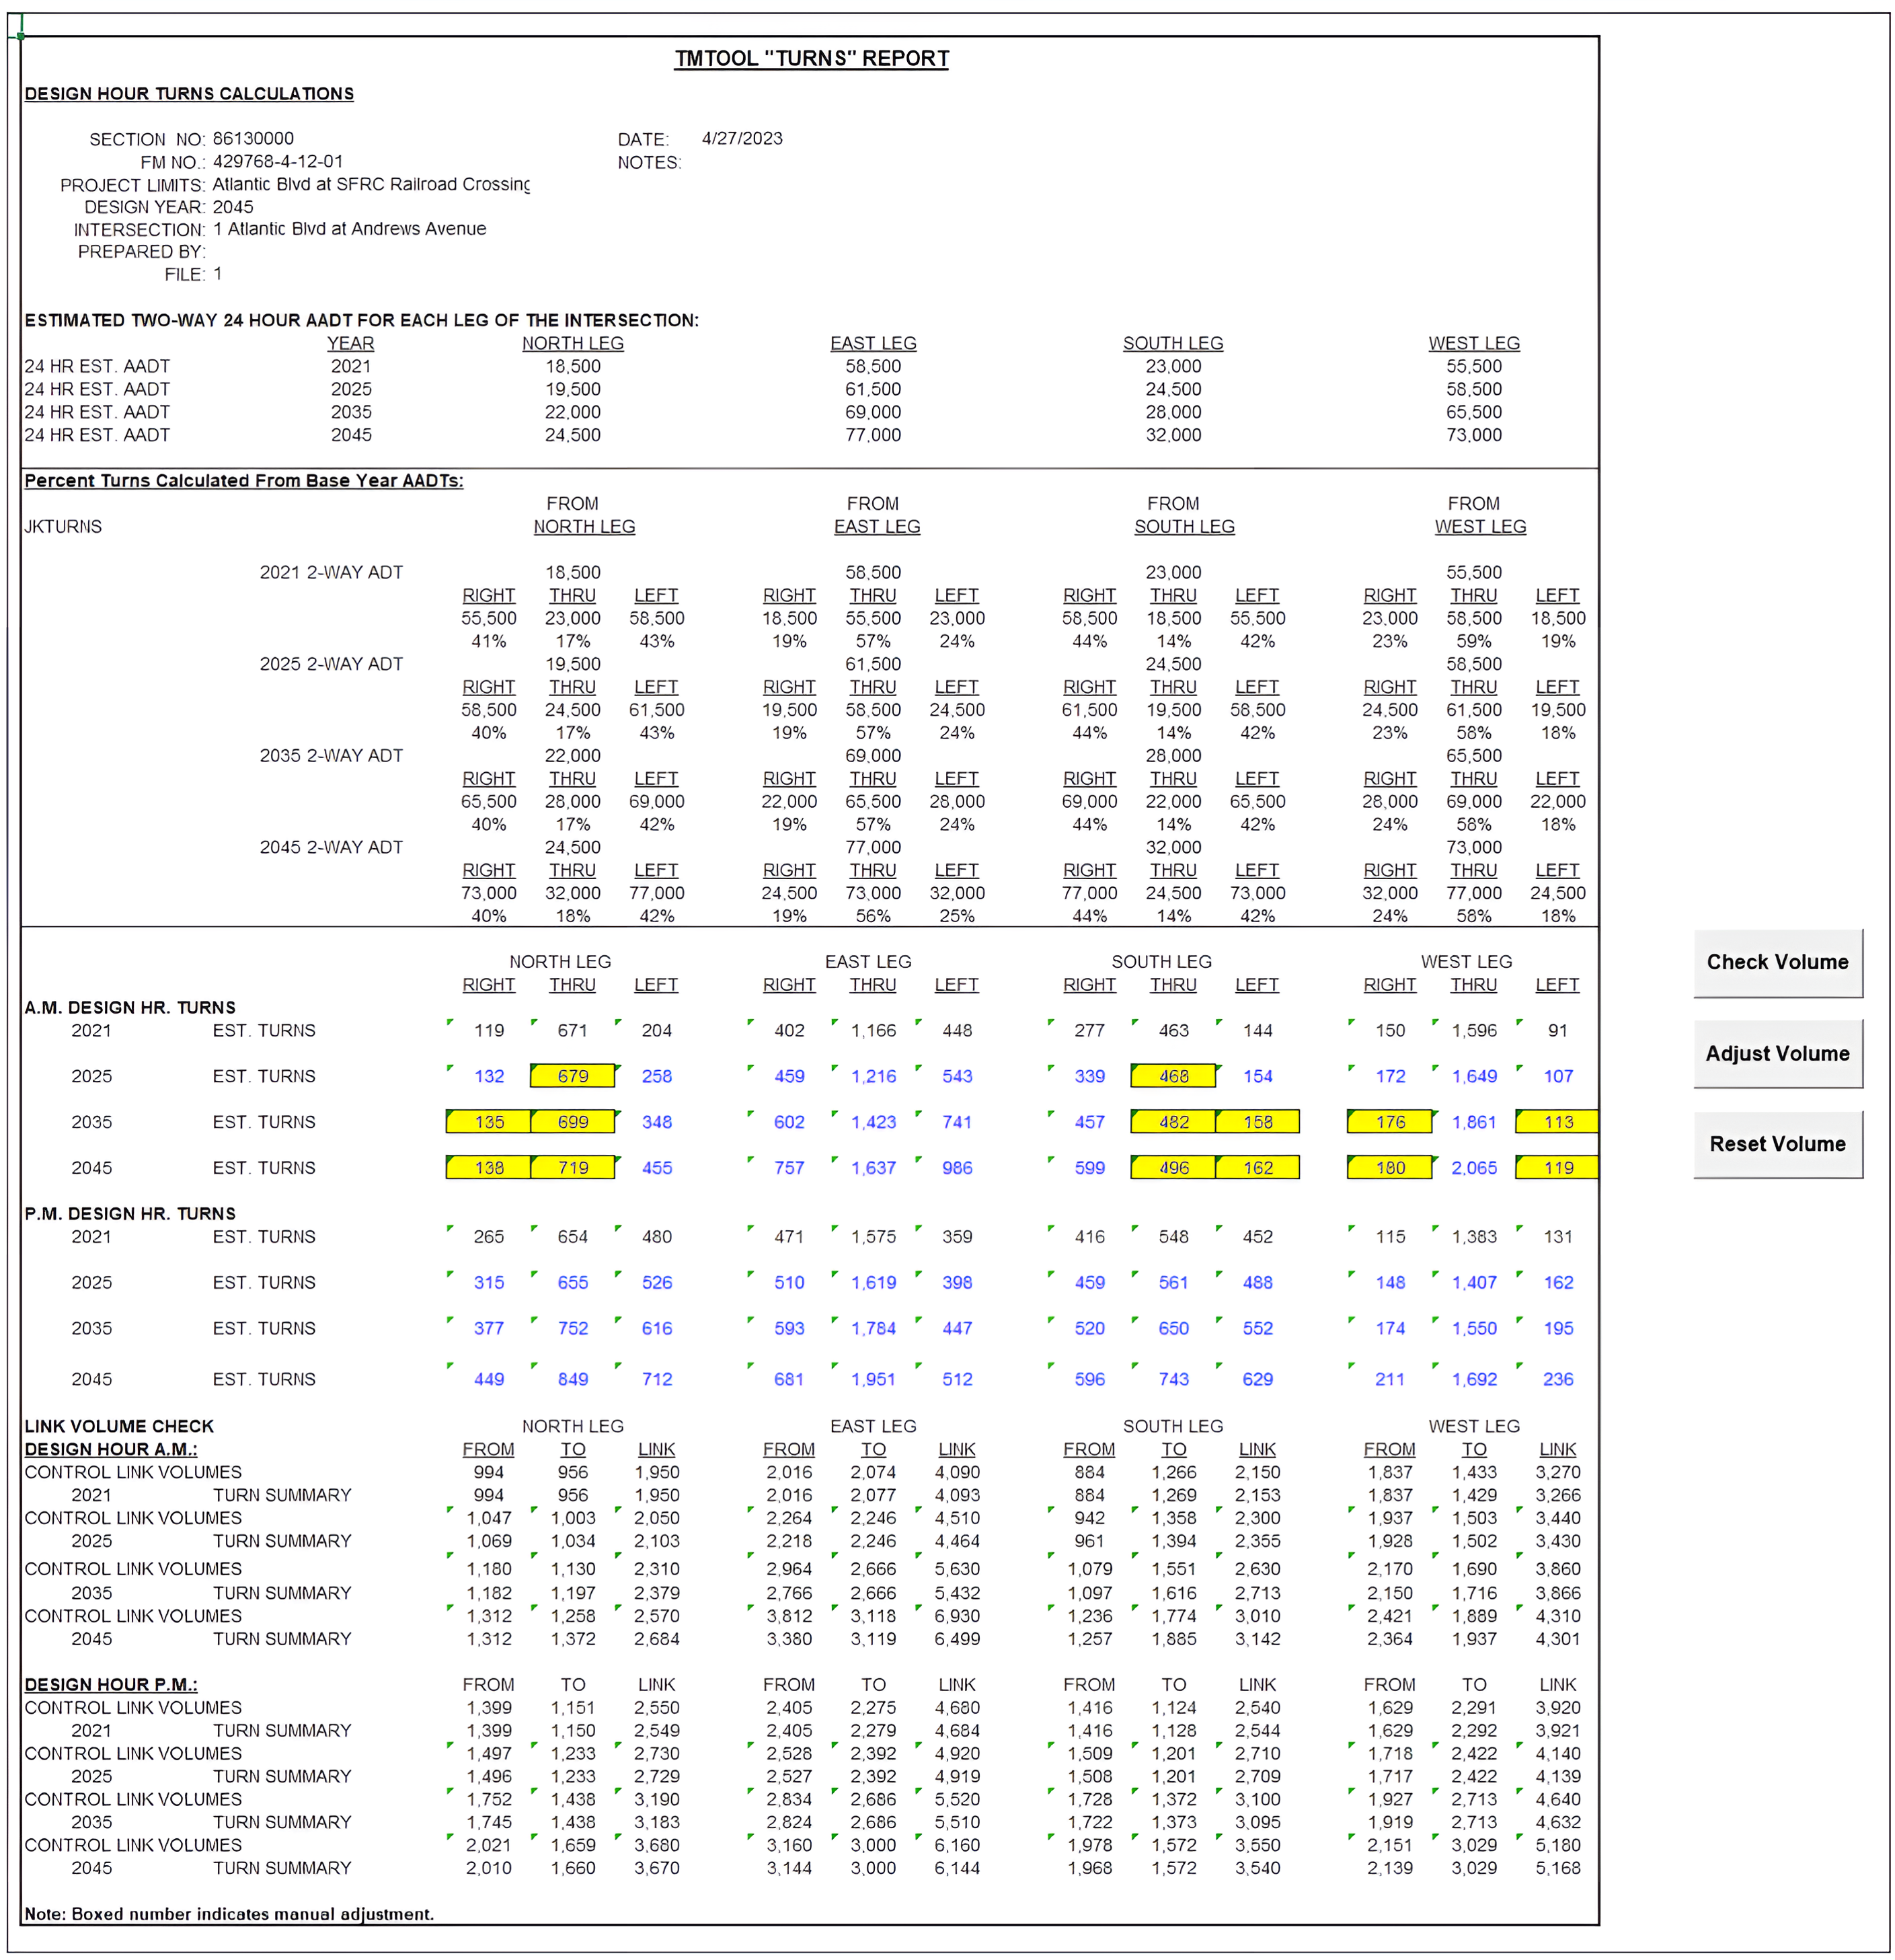
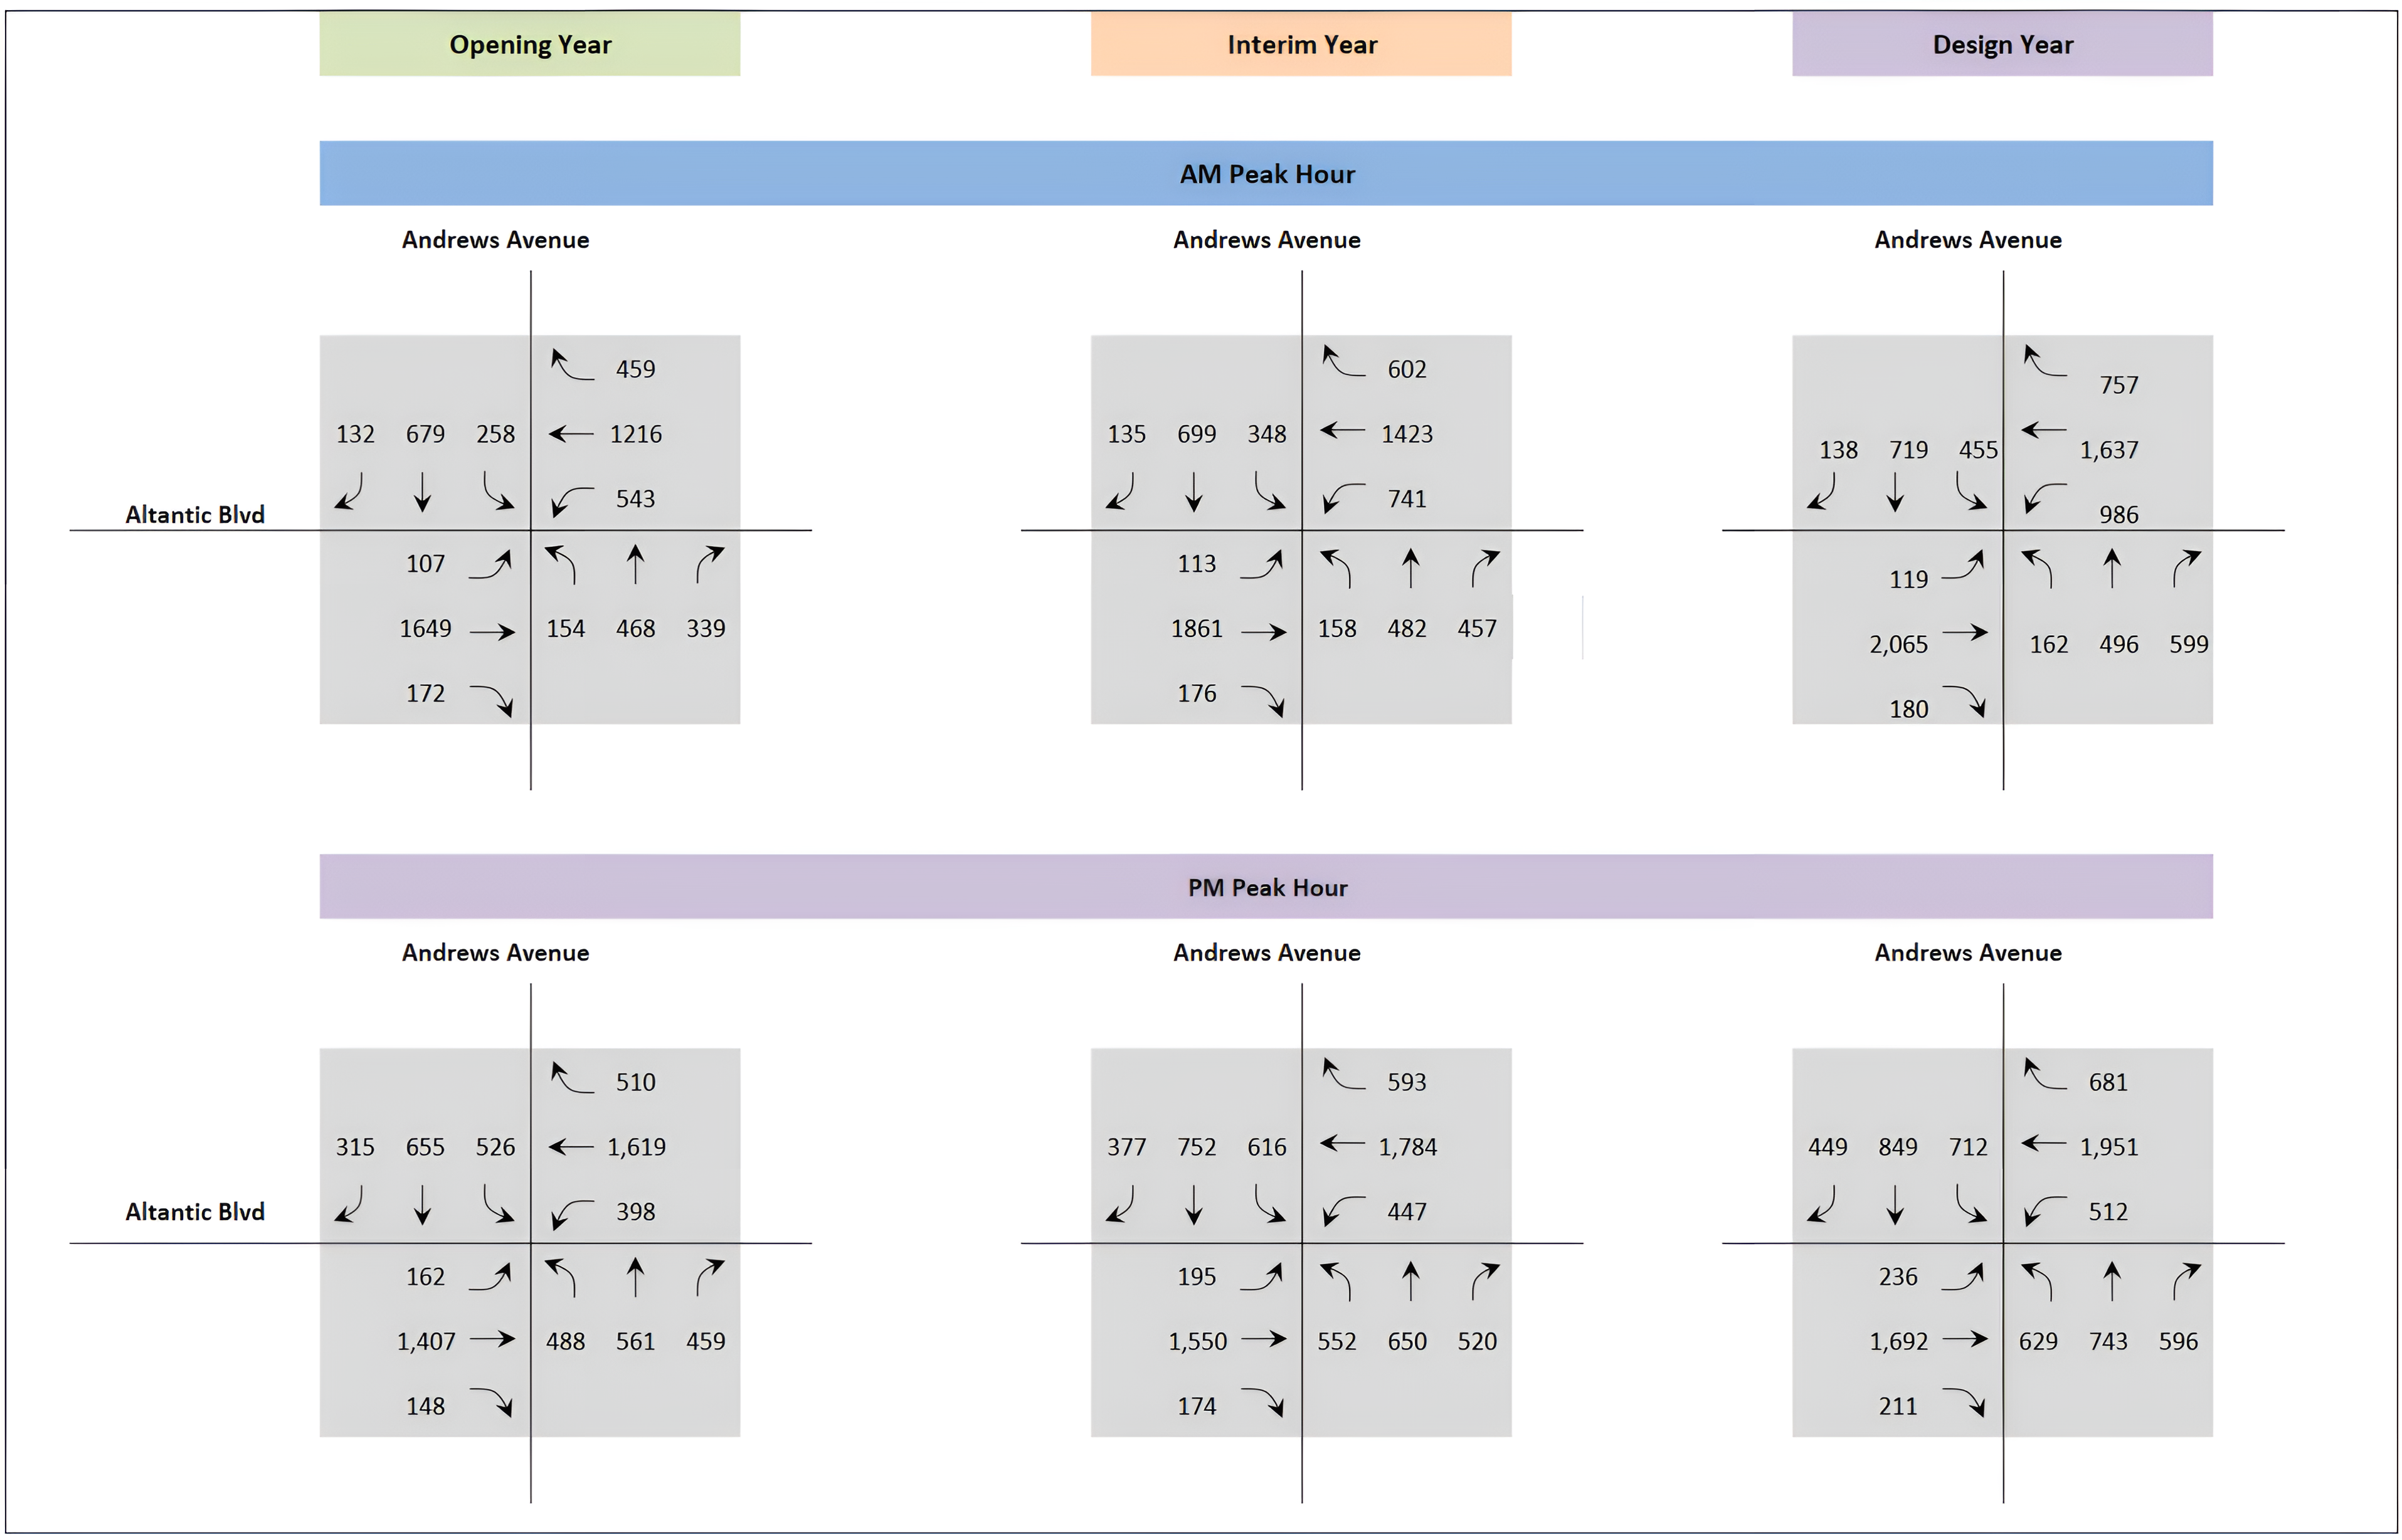
The future year turning movement volumes need to be checked and adjusted. There are three buttons on each output sheet. The future turning movement volumes will be shaded in blue if the volume is lower than the previous year’s volume once the “Check Volume” button is clicked. The future turning movement volumes will be adjusted so that the turning movement volumes will be increasing from the existing year through the design year. The volumes will be reset to the original forecasted volume if the “Reset Volume” button is clicked. Figure 7-13 shows the Output Tab for Intersection 1 – Atlantic Blvd at Andrews Avenue before any action was taken. After clicking the “Check Volume” button, cells with volumes lower than earlier years are highlighted in blue, as shown in Figure 7-14. After clicking the “Adjust Volume” button, those volumes that have been adjusted are highlighted in yellow, as shown in Figure 7-15. All the adjusted volumes are graphically displayed in the Figure_# tab for each study intersection, as shown in Figure 7-16. The user can copy and paste the figures for each intersection to a single worksheet and arrange the intersections based on their original relative location to each other. This will facilitate the smoothing and balancing of the traffic volumes so that the volumes between adjacent intersections are within the tolerance level along each roadway.
TMTool v2023 “Preview” Button
The “Preview” button will preview all the input and output for each intersection.
TMTool v2023 “Print” Button
The “Print” button will print the input and output of all intersections at one time. It is recommended to set the default printer to Adobe PDF or other printer that can generate PDF files so the output files can be further reviewed and incorporated into the study report.
TMTool v2023 “Save Data File” Button
The “Save Data File” function allows the user to save the data entered and generated during the study to the same data file. Alternatively, the user can save it to a different file name so the file can be later modified for other studies.