A refined model can be used as a basis to develop future year scenario models. Model results should always be checked for reasonableness. In many cases, post model processing is required to “smooth” the differences across the network and account for any errors associated with model output. Most FSUTMS models are set to forecast and report the Peak Season Weekday Average Daily Traffic (PSWADT). The PSWADT must be converted to AADT before being used for Project Traffic Forecasting applications using design traffic criteria. Refer to Section 4.7.3 for a discussion on converting PSWADT to AADT. The process for applying the model to project traffic is described as follows:
Develop Interim and Forecast Year Land Use and Network Scenarios
In forecasting interim and design year traffic, it may be necessary to incorporate recent changes in land use and/or changes in the network that are not reflected in the approved interim and design year data sets. These changes should be made with coordination and approval from the appropriate District Director or their designee(s) and the agency responsible for the model (i.e., MPO/TPO/TPA or local agency). Execute the model stream by selecting the corresponding scenarios using the appropriate key values from Scenario Manager in accordance with the model’’’s User’s Manual. The modeled traffic volumes can be obtained from the loaded highway network.

Evaluate Model Traffic Output
The forecasted model traffic must be evaluated for reasonableness. The best method of evaluation is to develop a traffic forecast based on historical trends following the steps referred to in Chapter 5. This trend-based forecast should then be compared to those generated by the model. Differences in volume in excess of 10% in high volume areas or 4,000 vehicles per day in lower volume areas should be further evaluated to explain the discrepancy. Other data sources include, but are not limited to, population estimates from the Bureau of Economic and Business Research (BEBR) at the University of Florida, US Census data products, and local economic activity data.
When comparing future model volumes with trends analysis results, it is important to remember that trends analysis assumes that future growth pattern will follow the same historical pattern in the past and the roadway facilities in the project area remain largely unchanged in the future. If future land uses are dramatically different from the existing ones, or if the future model includes major improvements on existing facilities or new facilities, the basic assumptions for trends analysis no longer hold. A direct comparison between model output and trends analysis results is not recommended. The user is advised to refer to Section 4.6.5 for reasonableness checks on future year forecasts.
Complete documentation of the traffic projection process, including reasonableness evaluation, should be included in the Traffic Report. Where the forecasted model traffic is to be utilized for alternative corridor assignments, additional evaluation for reasonableness should be performed. Screenlines and overall distribution of traffic assignments within the evaluated areas should also be considered.
Model Output Conversion Factor (MOCF) and Peak Season Conversion Factor (PSCF)
Most of the models used in Florida are validated to peak season travel conditions. The traffic volumes generated by the model represent the Peak Season Weekday Average Daily Traffic (PSWADT). The peak season is defined as the 13 consecutive weeks of the year with the highest traffic volume demand. The exceptions are the Southeast Regional Planning Model (SERPM), the Treasure Coast Regional Planning Model (TCRPM), District 1 Regional Planning Model (D1RPM), and the Florida Statewide Model (FLSWM), where the models are validated to average daily travel conditions and the model generated traffic volumes represent the Average Annual Daily Traffic (AADT). While PSWADT can be used for planning purposes, AADT is required to estimate the design hour traffic for design and operational analysis.
A Model Output Conversion Factor (MOCF) can be used to convert PSWADT to AADT. The MOCF is site specific and should be obtained from the Peak Season Factor Report provided by the FDOT Transportation Data and Analytics Office. The following sections describe how to obtain the necessary conversion factors to convert daily traffic counts to PSWADT and AADT, and how to convert PSWADT to AADT.
As mentioned in Section 2.4.1, Seasonal Factors (SF) are calculated for each week of the year for each permanent count station and reported in a Peak Season Factor Category Report. Peak Season Factor Category Reports are prepared by volume category and by county and are available through the Florida Traffic Online Web Application. Seasonal Factors are used to convert an average weekday 24-hour traffic count (in vehicle) to AADT (see Equation 4-2).
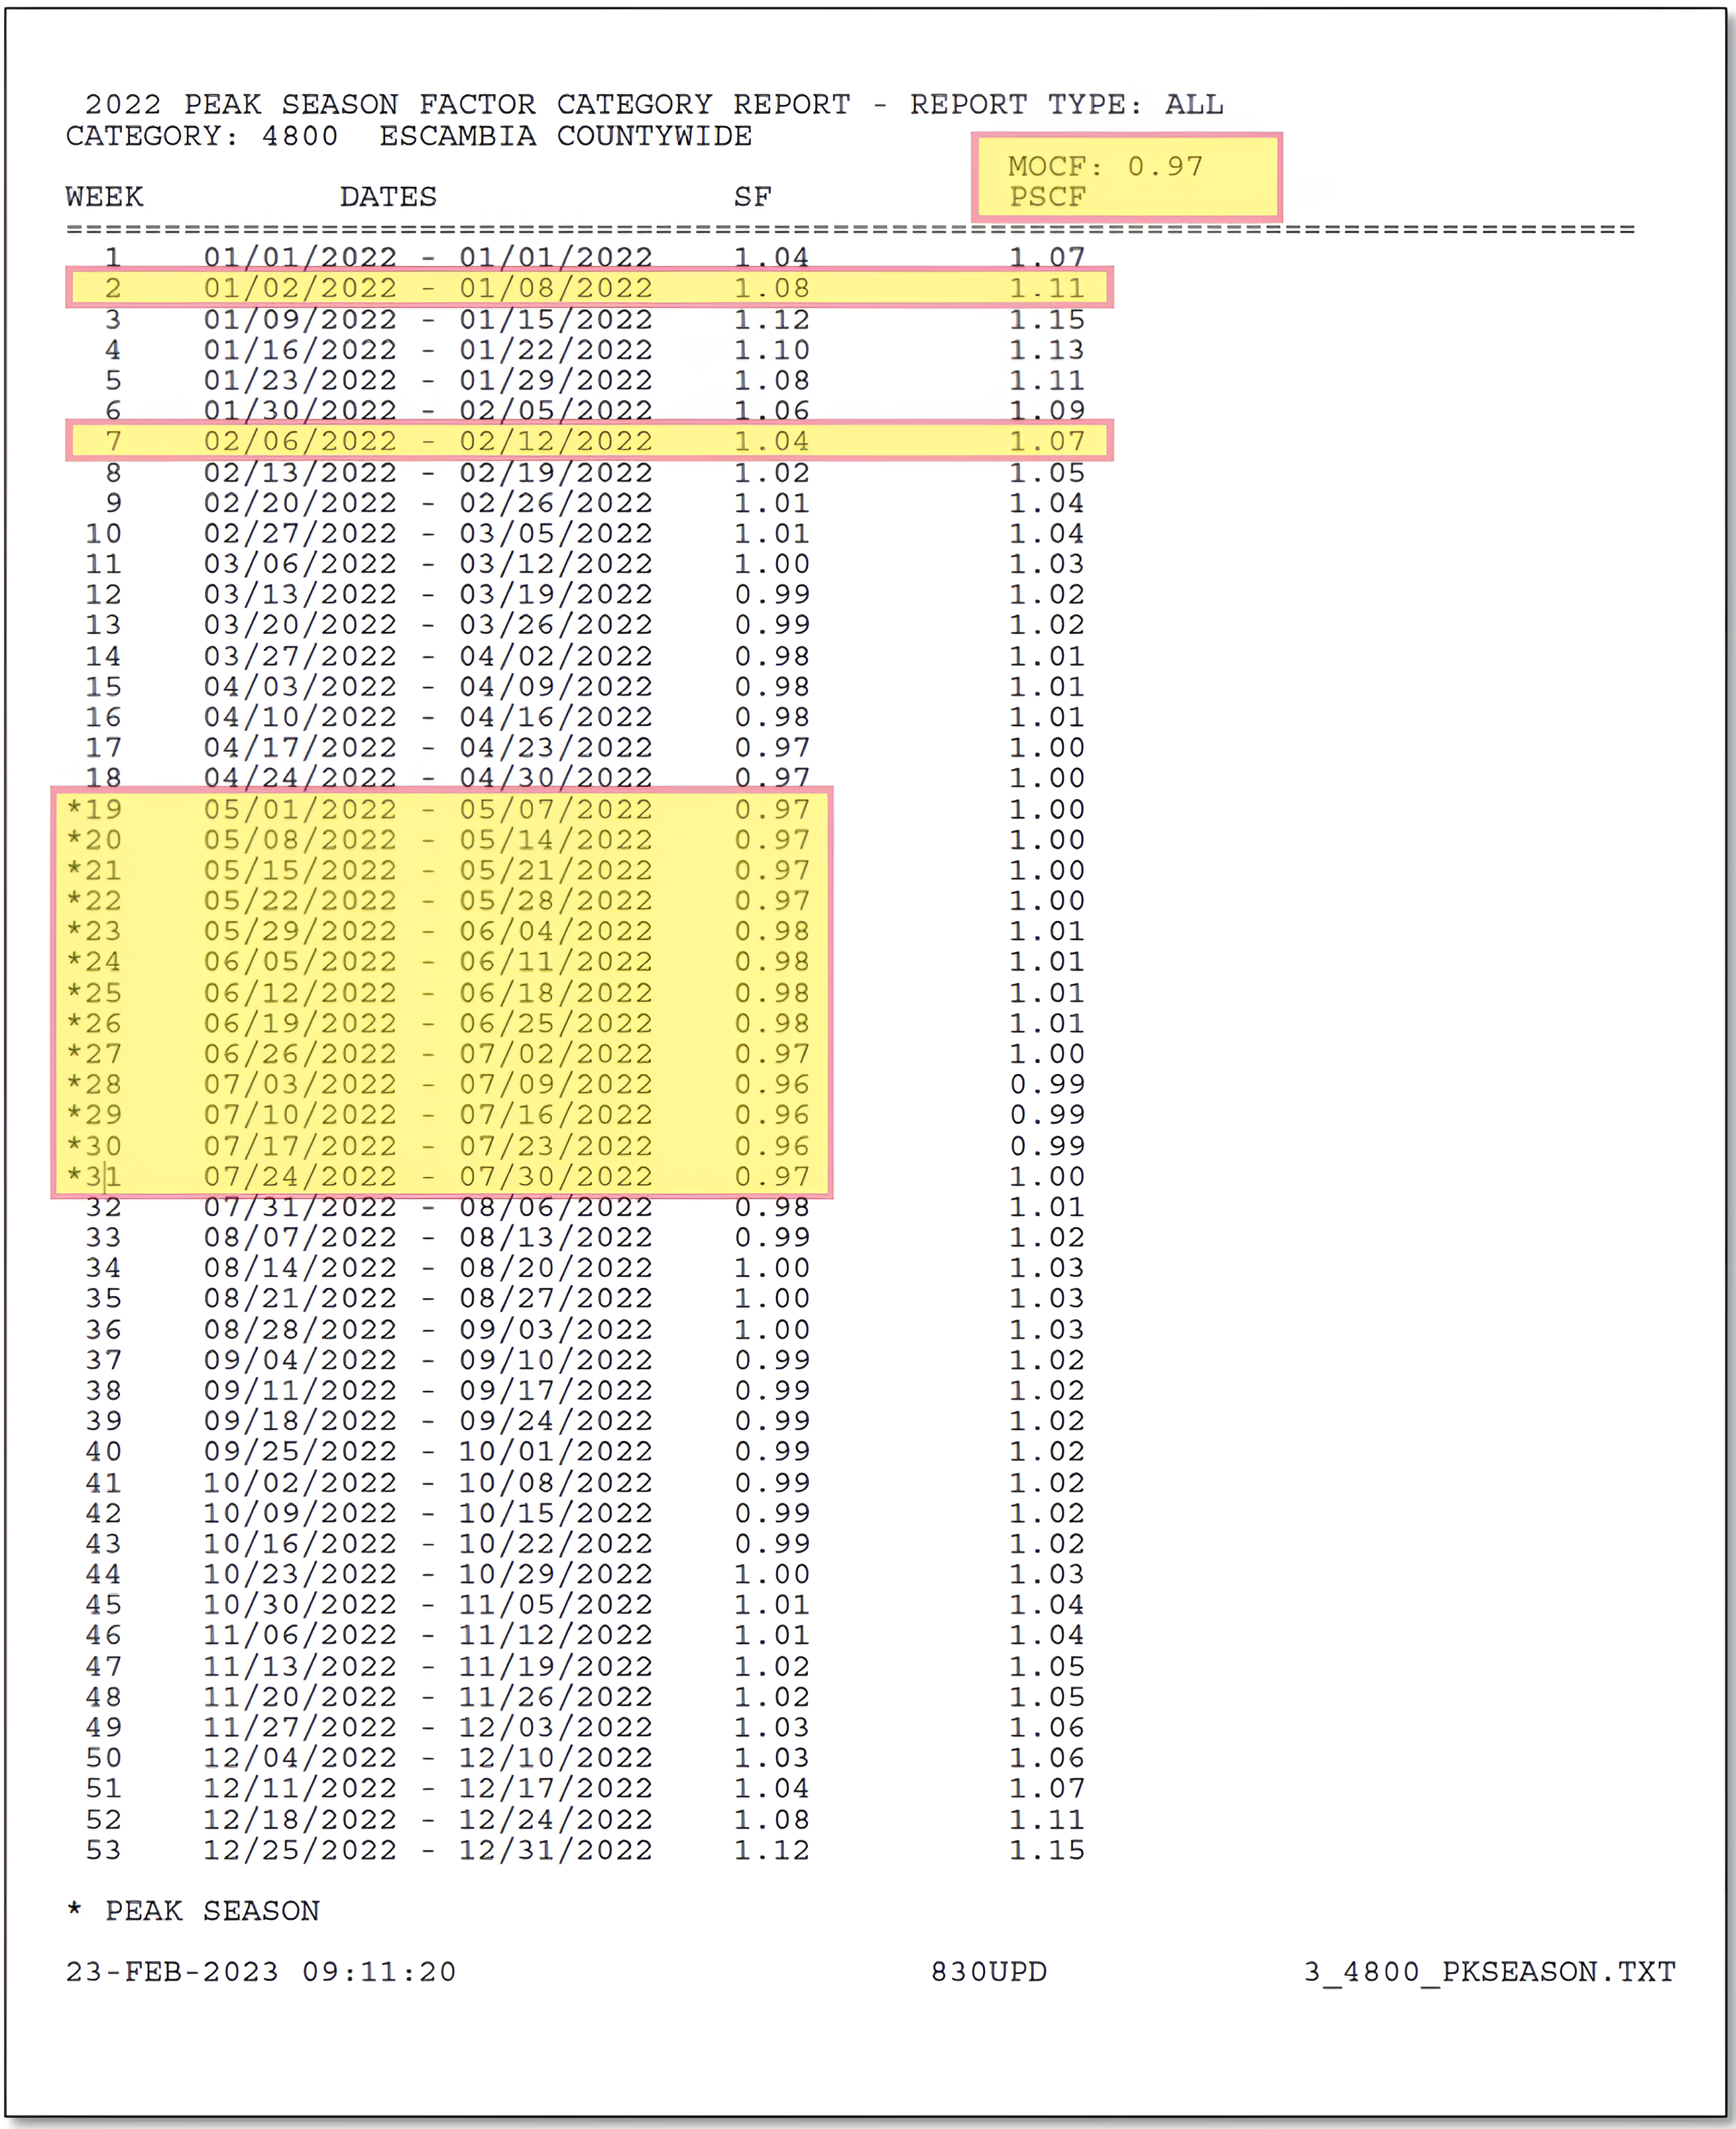
Figure 4-5 shows an example Peak Season Factor Category Report for Category 4800 covering the entire Escambia County that is not covered by other categories in the county.
The weekday Peak Season Factor Category Reports also include Model Output Conversion Factors (MOCF). The MOCF is the average of Season Factors for the 13 consecutive weeks during which the highest weekday volumes occur and when the sum of SFs for those 13 weeks is the lowest. In this example, MOCF is the average of the 13 SFs from Week 19 to Week 31, which is equal to 0.97 for this category. The MOCF is used to convert the traffic volumes generated by a travel demand forecasting model (PSWADT) to AADT (see Equation 4-3.)
Weekly factors obtained from FDOT continuous count stations around the State are used to prepare annual updates of the Peak Season Conversion Factors (PSCFs). PSCFs are obtained by dividing the SFs by the MOCF for the same week. For example, for the second week of 2022 from January 2, 2022 to January 8, 2022 for Category 4800 in Escambia County (Figure 4-5), the SF is 1.08, the MOCF for the category is 0.97. The corresponding PSCF can be calculated by dividing SF of 1.08 by MOCF of 0.97, which yields 1.11. The PSCFs are used to convert a 24-hour count, representing the average weekday daily traffic, to PSWADT (see Equation 4-4).
Validating a Project Level Travel Demand Model often requires collecting additional traffic counts in the study area. Depending on the model being used, the short-term traffic counts will need to be converted to either AADT or PSWADT before coded into the model network. For example, a 24- hour traffic count of 35,487 vehicles was taken on a roadway in Escambia County on Wednesday, February 7, 2022 for a corridor study. The Northwest Florida Regional Planning Model (NWFRPM) is being used for the study. Since the NWFRPM model is a PSWADT based model, the short-term count needs to be converted to PSWADT before being included in the model network for model validation purposes. According to Figure 4-5, the PSCF for the 7th week of February 6 – 12, 2022 is 1.07. The short-term counts can be converted to PSWADT as follows:
\({Daily\space{Count}}\times{Peak \space{Conversation} \space{Factor}}=PSWADT\)
\(35,487 (daily \space{count})\times{1.07(PSCF)}=37,971\rightarrow{38,000(PSWADT)}\)
The SF is used to convert any weekday 24-hour count to AADT. For example, the same count above could be converted to AADT and rounded using AASHTO Standards as follows:
\({Daily \space{Count}}\times{Seasonal \space{Factor}}=AADT\)
\(35,487 (daily \space{count})\times{1.04(SF)}=36,906\rightarrow{37,000(AADT)}\)
The MOCF is used to convert model output to AADT when necessary. Based on Figure 4-5, the MOCF for Category 4800 in Escambia equals to 0.97. In the same example, after the model is validated, the model is used to forecast future travel demand. If the model volume for the same location for the design year is 42,349, the AADT can be obtained by applying MOCF as follows:
\({PSWADT}\times{MOCF}=AADT\)
\(42,349 (PSWADT)\times{0.97(MOCF)}=41,079\rightarrow{41,500(AADT)}\)
Note that this conversion must be made for Project Traffic Forecasting using design traffic criteria. If the traffic forecast is based on historical trend analysis where historical AADT volumes are used, the process does not require any data conversion.
Adjusting Future Year Model Volumes Due to Base Year Model Volume Deviations
There are inherent discrepancies between base year model volumes and base year traffic counts. Future year model volumes are often adjusted to account for possible traffic assignment errors. The underlying assumption is that errors associated with base year model assignment results could continue to occur proportionally in any future year forecasts. NCHRP Report 255 offers guidelines for making such adjustments and the methods are still valid and frequently used in practice. For convenience purposes, these guidelines are repeated here.
A future year link volume is adjusted using two (2) factors: the ratio of the actual base year traffic count to the base year model volume and the numerical difference between the actual base year traffic count and the base year model volume. The two (2) factors are then applied to the future year model volumes using Equation 4-5 and Equation 4-6.
Ratio Adjustment:
Difference Adjustment:
Where
\(V_{r\_adj}\) = adjusted future year model volume by ratio method
\(V_{d\_adj}\) = adjusted future year model volume by difference method
\(Count\) = base year traffic count
\(V_{b}\) = base year model volume
\(V_{f}\) = future year model volume
The final adjusted future year traffic forecast, Vadj, is then the average of the two (2) adjusted model volumes Vr_adj and Vd_adj, as shown in Equation 4-7.
Two (2) issues may occur with either the ratio adjustment method or the difference adjustment method. If Vd_adj, is a large negative number and its absolute value is higher than Vr_adj, the adjusted future volume Vadj could be a negative number. in this case, it is suggested that only the ratio adjustment method be used. On the other hand, if the base year count is significantly higher than the base year model volume, the adjusted future year volume could be excessively high. In this case, it is suggested that only the difference adjustment method be used.
These adjustments should only be applied to roadways that are not expected to experience a significant increase in capacity in the future. Where major capacity change will occur (i.e., greater than 25 percent), there are usually other extraneous factors, such as land use implicit in the future year model results. The assumption that the base year assignment errors will carry over proportionally in future year forecasts may no longer hold. The user must exercise professional judgement when applying these methods.