The AADT, the peak-to-daily ratio or the design hour factor (K), the directional distribution factor (D), and the percent trucks (T) are critical numbers that determine the geometric configuration of a roadway. In addition, the T factor is critical for determining the type and thickness of pavement during design.
The actual AADT and other traffic factors can only be measured through Continuous TMS locations that collect data 365 days a year. In most cases, traffic parameters have to be estimated from shortterm traffic counts. The information collected from Continuous TMS locations provides a statistical basis for estimating traffic parameters for short-term traffic counts.
Annual Average Daily Traffic (AADT)
Average Daily Traffic (ADT) is obtained from a short-term traffic count. Short-term traffic counts are commonly referred to as “raw counts” or simply “traffic count.” ADT is typically a 72-hour traffic count collected on Tuesdays, Wednesdays, and Thursdays. However, ADT can be based on the simple average of any short-term traffic counts at least 24 hours long. The 24-hour and 48-hour traffic counts are often taken to measure ADT and converted to AADT for traffic forecasting projects. For traffic forecasts, the SF and ACF, where applicable, should be used to convert ADT to AADT as shown in Equation 2-3.

When the ADT is adjusted by SF and ACF assigned to that site, it will provide a statistically accurate estimate of AADT at that location.
K Factor and Standard K Factor Range
2.5.2.1 K Factor
The K factor is defined as the proportion of AADT occurring in the peak hour. It is one of the most critical traffic factors in roadway planning and design. The K factor is often referred to as the Design Hour Factor, as it relates to the proportion of the AADT during the design hour for the design year. The Design Hour Volume (DHV) is total traffic in both directions expected to occur during the design hour for the design year, and it is determined by multiplying the AADT by the K factor. Equation 2-4 shows the relationship between AADT, DHV, and K:
2.5.2.2 Standard K Factor Range
The traditional practice of determining the K Factor has been using the hourly volume during the 30th highest hour in a year and dividing the hourly volume by AADT. This was first introduced in the 1950 Highway Capacity Manual (HCM) and the 30th highest hour was referred to as the design hour. It was inferred that designing a facility based on the 30th highest hourly volume of the year would be most cost-effective. Other peak hours, such as 100th highest hours, or 200th highest hour, have also been used to determine the K Factor. Even though the most accurate way to develop the K Factor is to have a Continuous TMS station on every roadway segment, this is very unlikely due to costs associated with maintaining and operating such a system. It is often necessary to estimate the K Factor using short-term traffic counts.
In 2011, based on comprehensive analyses and extensive public outreach, FDOT established statewide “Standard K Factors” that was applied to develop project traffic forecast from the planning phase through the design phase of the project. Standard K Factors were fixed parameters predetermined based on area type and facility type with consideration to typical peak periods of the day. The Standard K Factors also reflected urban development patterns and economic activities. The purpose of using the statewide Standard K Factors was to promote better transportation policies and projects, reduce time and effort developing various peak hour numbers, and provide consistency and simplicity in project traffic development.
Over the last decade, there have been significant changes in travel patterns as the State experienced varying economic cycles. There has also been documented need for deviation from the Standard K Factors. In 2021, the FDOT Systems Implementation Office (SIO) initiated a review of the statewide practice to determine if a modification to the Standard K Factors is needed. The study concluded that there was indeed a need to update the current Standard K values. Based on the analysis performed using information obtained from the TDA Office and field count data, FDOT SIO developed a new approach and proposed changes to the current Standard K Factors. The approach and the recommendations are documented in the FDOT White Paper - Standard K Evaluation (Appendix A). The recommended changes to the Florida Standard K Factors were formally approved by the Federal Highway Administration (FHWA) on July 12, 2023. The approval letter can also be found in Appendix A.
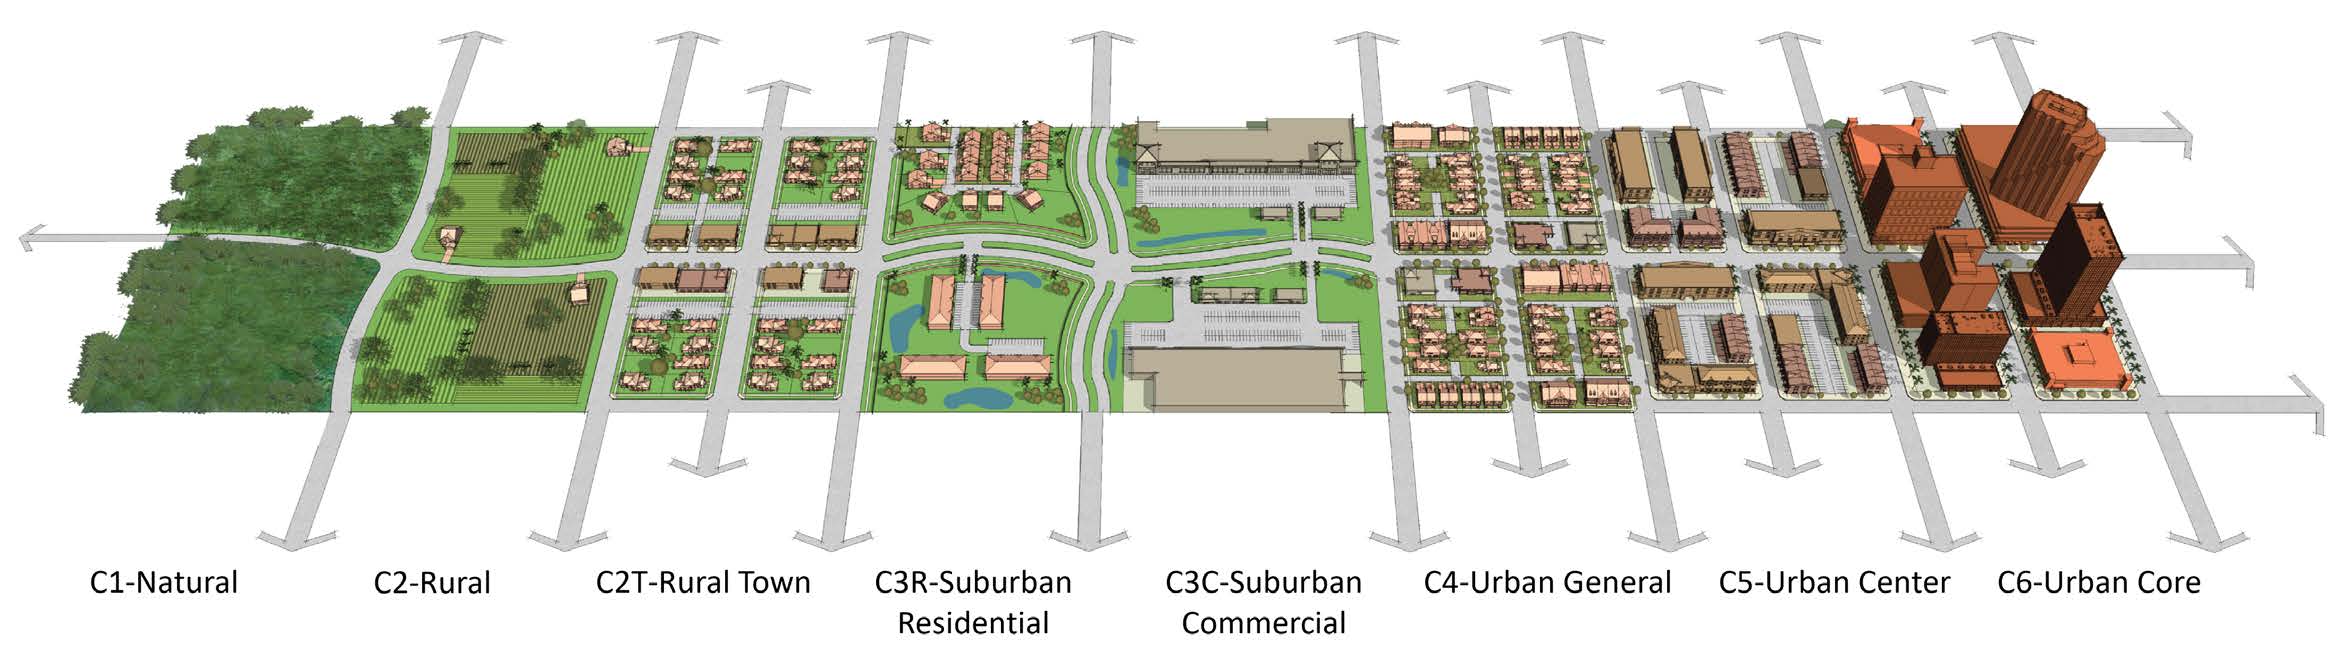
The new approach to developing the Standard K Factors considers context classification, area type, and facility type of a roadway segment. The FDOT Context Classification System comprises eight (8) context classifications in its efforts to plan, design, construct and operate a context-sensitive system. The Context Classification System broadly identifies the various built environments existing in Florida. FDOT’s Context Classification System describes the general characteristics of the land use, development patterns, and roadway connectivity along a roadway, providing cues as to the types of uses and user groups that will utilize the roadway. The context classification of a roadway should be considered when selecting a Standard K Factor for the project. These context classifications are described and shown in Figure 2-4.
The following changes to the current Standard K are recommended:
- The Standard K should be converted from a single value to a Standard K Factor Range of two (2) percentage points.
- The roadway context classifications should be used when determining the Standard K Factor Range. Roadway classifications are defined based on context classifications where they are located. Based on roadway classifications having similar area types and the same recommended K Factor Range, the following roadway classifications are combined:
- Three (3) additional roadway classifications are included for limited access facilities:
- • C1-Natural, C2-Rural and C2T-Rural Town
- • C3C-Suburban Commercial, C3R-Suburban Residential and C4-Urban General
- • C5-Urban Center and C6-Urban Core
- • Limited Access-Rural
- • Limited Access-Urban
- • Limited Access-Urban Core
Urban and urban core areas are defined as an approved boundary, which encompasses the entire Census Urbanized Area, as well as the surrounding geographic area likely to become urbanized within the next 20 years, as agreed on by FDOT, FHWA, and the MPOs. Urban core area types are distinguished by whether the area’s population is greater than or less than one (1) million. Currently, the grouping of more than one (1) million applies to the urban areas that include central cities: Fort Lauderdale, Jacksonville, Miami, Orlando, St. Petersburg, Tampa, and West Palm Beach. The minimum population for an urban area is 5,000. Generally, for a rural area, the population is less than 5,000 and it is not immediately adjacent to an urban core or urban areas.
FDOT’s recommended standard K Factor Ranges are presented in Table 2-1. The single Standard K Factor currently provided on Florida Traffic Online for each count location would be replaced with the recommended K Factor Range based on the count locations’ roadway context classification in the future in coordination with the TDA Office.
| Roadway Classification2 | Area Type | Facility Type | Recommended K Factor Range (%)3 |
|---|---|---|---|
| C1 – Natural C2 – Rural C2T– Rural Town |
Rural | Highways and Arterials | 8.5 – 10.5 |
| C3C – Suburban Commercial C3R – Suburban Residential C4 – Urban General |
Suburban and Urban | Arterials | 7.5 – 9.5 |
| C5 – Urban Center C6 – Urban Core |
Urban Core | Arterials | 7.0 – 9.0 |
| Limited Access (LA) | Rural | Freeways | 8.5 – 10.5 |
| Urban | Freeways | 7.5 – 9.5 | |
| Urban Core | Freeways | 7.0 – 9.0 |
Notes:
(1) A single K Factor, within the range, should be selected based on the project’s conditions.
(2) Refer to FDOT Context Classification Guide when determining roadway context classification.
(3) A K factor has a theoretical minimum value of 4.17%, or 1/24, which corresponds to the condition where there is no peaking during the entire 24-hour period. K factors outside the recommended K Ranges would need to be discussed and approved by the Systems Implementation Office (SIO). K Factors lower than 4.17% will not be accepted.
(4) K factors are not applicable for the planning, design or operation of toll facilities or managed lanes.
It is recommended that the selected K Factor for a project falls within the K Factor Range. The
selected K Factor should be representative of the project study area. With the new K Factor Range,
there could still be cases where the K Factor Range may not directly apply. Examples include
highway facilities in tourist areas or roadways providing access to cruise ports where the heaviest
traffic may occur on the weekend and peak-to-daily ratios are higher than the K Factors. In such
cases, short-term traffic counts that include both weekdays and weekends should be collected.
K Factors should be developed by analyzing the short-term traffic counts and relevant traffic
information from FTO, if available. The K Factor Range in Table 2-1 would not be applicable for
the planning, design, or operation of toll facilities (e.g., Turnpike), interchange ramps, or managed
lanes. Once a K Factor is selected, the same K Factor should be used for all future scenarios for the
same analysis year. Different K Factors are allowed for interim years; however, discretion should be
exercised when determining the K Factors for the interim years by examining the growth pattern
between existing year and future years.
2.5.2.3 Standard K Factor Selection Process
For any project, a single K Factor should be selected based on context classification, area type, facility type, and field data if available. A summary of the K Factor selection process is shown in Figure 2-5 and further explained in detail below.
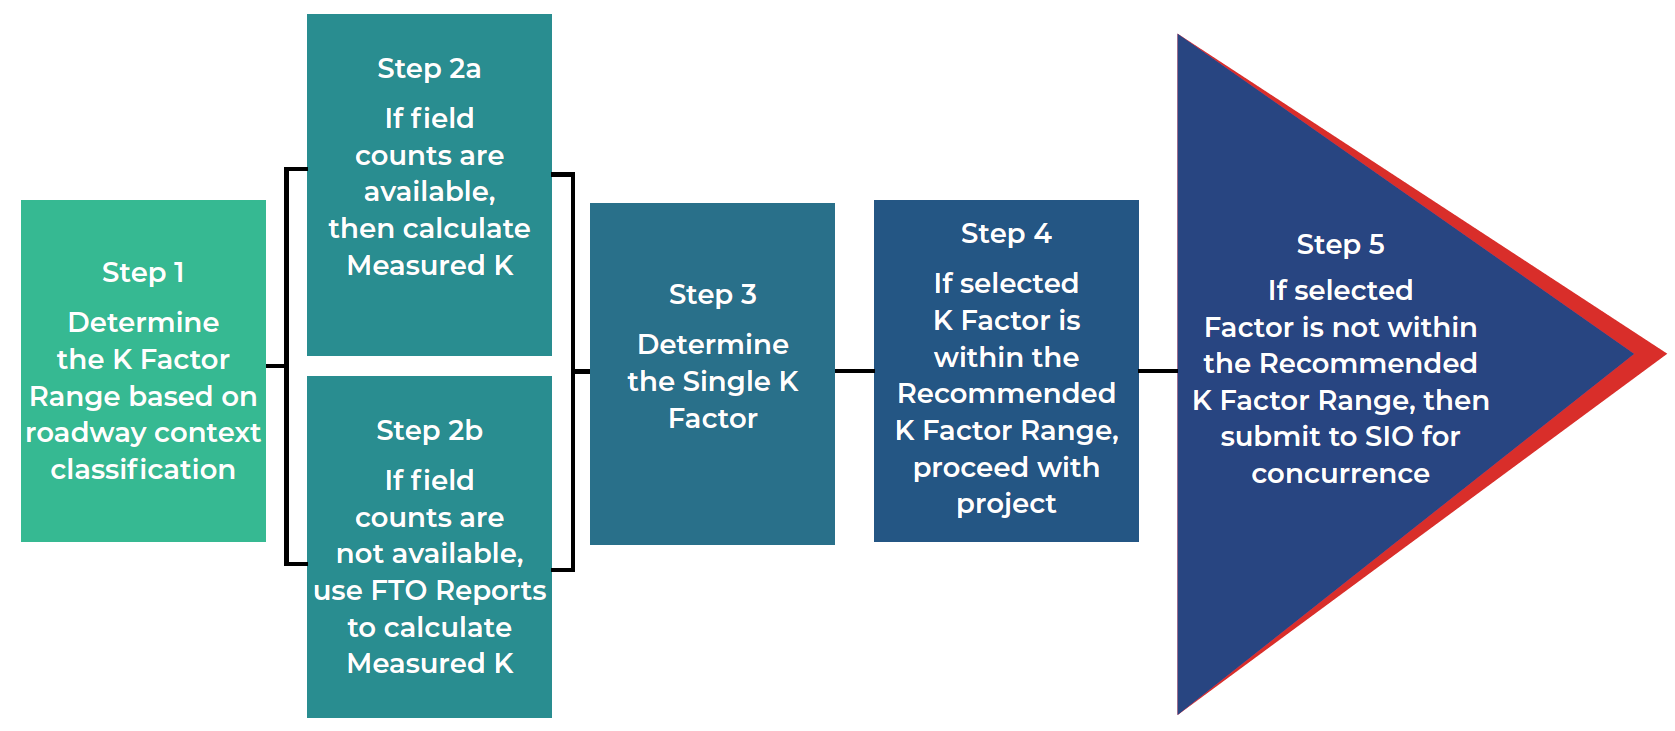
Step 1: Based on roadway context classification, determine the K Factor Range for roadways within the study area.
Step 2a: If field counts are available for the project, then calculate the K Factor using the daily field hose counts. Peak hour/period counts should not be used to calculate the K Factor.
Step 2b: If field counts are not available for the project, counts from the Florida Traffic Online count stations can be utilized to calculate the measured K Factor. Two (2) types of count sites, Continuous and Short-term, are provided. To calculate the K Factor using these two (2) types of count sites, the following reports can be used:
- For Continuous TMS, the “Hourly Continuous Counts Final Report” can be used to calculate the K Factor. The K Factor should be calculated using count data collected during the project time period.
- For Short-term TMS, the “Synopsis Report” for the count site can be used to calculate the K Factor.
Step 3: Determine the single K Factor value for the project roadways.
Step 4: If the selected K Factor value is within the recommended K Factor Range, then proceed with design hour project traffic development.
Step 5: If the selected K Factor value is not within the recommended K Factor Range, then the project team should present the K Factor recommendation along with supporting documentation to the District and SIO for concurrence. Supporting documentation could include observed and historical counts, detailed analysis of peaking characteristics, and data from similar facilities.
D Factor
2.5.3.1 Directional Distribution
The Directional Distribution (D) is the percentage of the total, two-way design hour traffic traveling in the peak direction. In addition to traffic information such as AADT and K Factor, D is an essential parameter used to determine the Directional Design Hour Volume (DDHV). The DDHV is the basis of geometric design. A highway with a high percentage of traffic in one direction during the design hour may require more lanes than a highway having the same AADT but with a lower percentage. DDHV is determined by multiplying the Design Hour Volume (DHV) with the Directional Distribution Factor (D), as shown in Equation 2-5:
Directional distribution is also an important factor in highway capacity analysis. This is particularly true for two-lane rural highways. Capacity and Level of Service (LOS) vary substantially based on directional distribution because of the interactive nature of directional flows on such facilities. Queuing, delays, land use, and capacity are some of the factors that affect the directional distribution.
Although there is no explicit consideration of directional distribution in the analysis of multilane facilities, the directional distribution has a significant impact on both design and the calculation of the LOS of a facility. For example, urban commuting routes have been observed to have up to two-thirds of their peak hour traffic in a single direction. The peaking occurs in one direction in the morning and in the opposite direction in the evening. The facilities need to provide sufficient capacities to accommodate the peak flows for both directions. This phenomenon has led to the use of reversible lanes on some urban freeways and arterials.
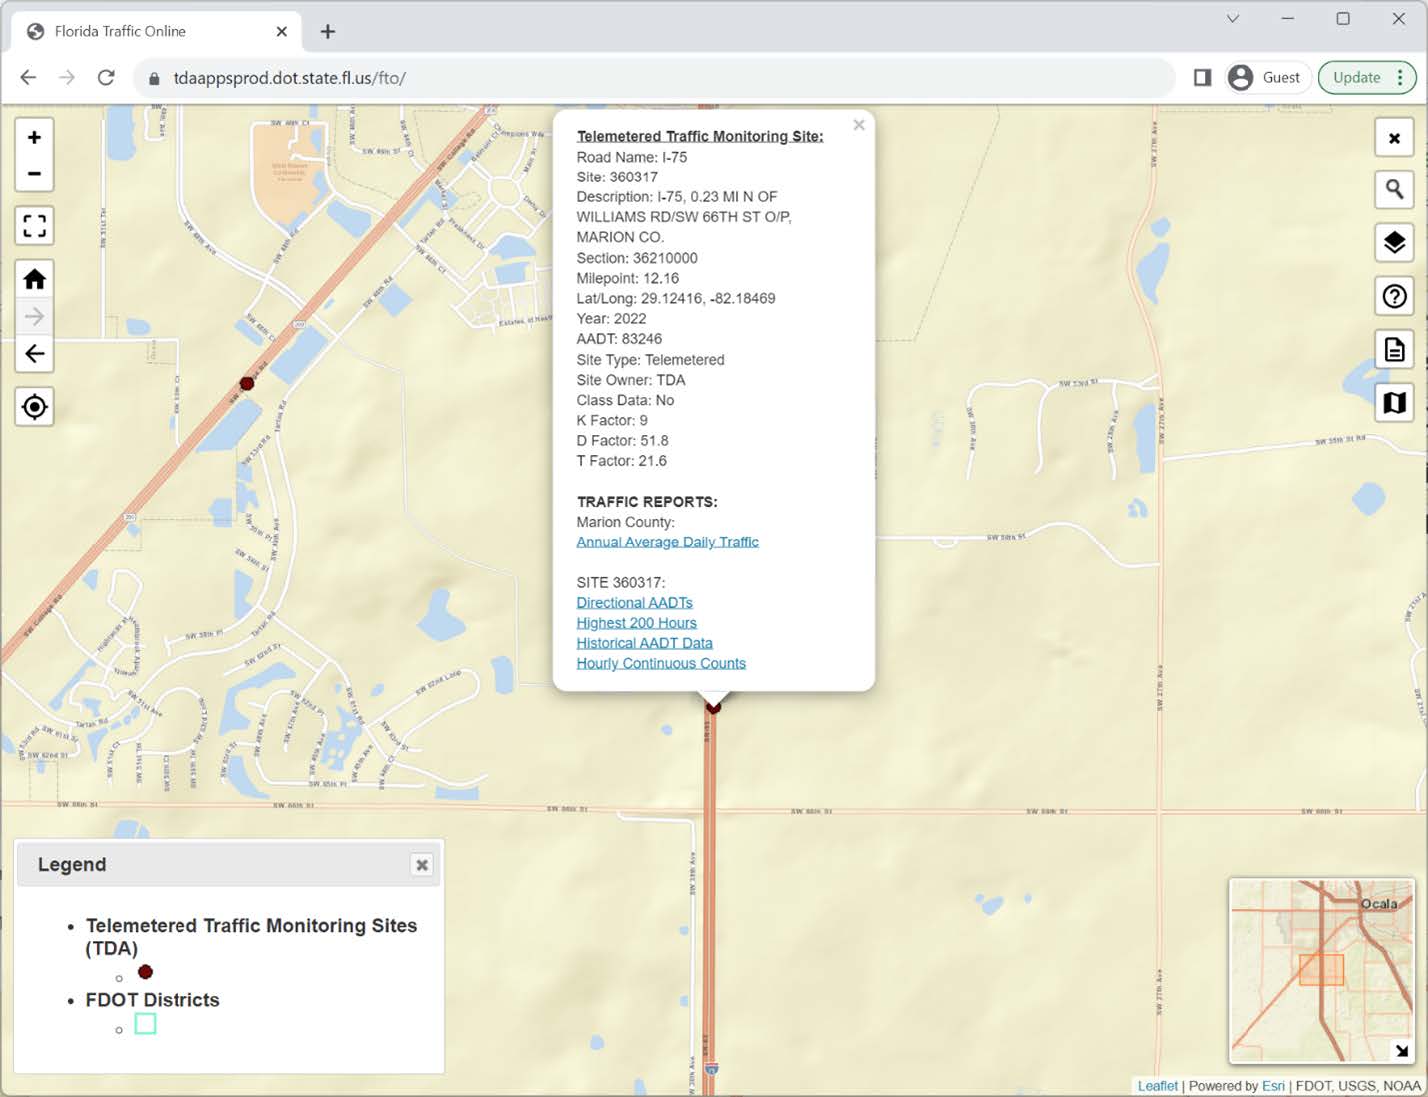
The TDA Office is responsible for calculating and estimating D factors at Continuous and Shortterm traffic monitoring sites. For Continuous sites, the D factor is the median D factor of the 200 highest hours. For Short-term sites, a D factor is assigned based on either the Seasonal Factor Category or Districtwide Functional Classification Category that the site belongs to FDOT (2023 Traffic Monitoring Handbook). The D factors are reported in the Florida Traffic Online Application. Figure 2-6 shows an example of traffic information available at Continuous TMS 360317, located on I-75 in Marion County. It includes detailed information about the site, AADT, Standard K (which will be replaced in the future with Standard K Range), D, and T factors. A number of Traffic Reports are also available on the site, including Annual Average Daily Traffic, Annual Vehicle Classification, Directional AADTs, Highest 200 Hours, Historical AADT Data, and Hourly Continuous Counts.
2.5.3.2 Acceptable D Values
The D Factors for continuous and short-term sites can be obtained from Florida Traffic Online. The D values are also available from FDOT’s RCI and TCI databases. If traffic counts for the project site are not available, obtain short-term traffic counts to determine hourly traffic volume distribution. This will allow the identification of the peak hour of the day and peak direction during the peak hour. If no counts are available, the intersecting roadways that are non-state maintained will use the same D Factor as the project roadway on the state highway system. The D Factors should be checked to see if they are within the allowable range. The recommended D Factors are shown in Table 2-2.
| Road Type | Low | D | High | Standard Deviation |
|---|---|---|---|---|
| Rural Freeway | 52.3 | 54.8 | 57.3 | 1.73 |
| Rural Arterial | 51.1 | 58.1 | 79.6 | 6.29 |
| Urban Freeway | 50.4 | 55.8 | 61.2 | 4.11 |
| Urban Arterial | 50.8 | 57.9 | 67.1 | 4.60 |
Percent Trucks (T)
There are ten (10) classes of trucks, including buses, according to the current FHWA Vehicle Classification Scheme F (see Figure 2-2). Truck data is used in many different applications. As a result, various definitions of truck percentages exist (i.e., Tf, T24, 24T+B, 24T, DHT, DH2, and DH3) and they are all calculated as percentages of trucks in total traffic. Detailed definitions for these truck factors can be found in Appendix C – Glossary.
The traffic forecasting “T” is the same as T24 or 24T+B. It includes trucks and buses from Class 4 to Class 13. The truck volume and AADT are related to each other by a ratio commonly known as “T.” The Daily Truck Volume (DTV) is the total number of trucks traversing a roadway segment during a 24-hour period. It can be derived by multiplying AADT by T, as shown in Equation 2-6.
For traffic forecasting purposes, the Design Hour Truck (DHT) is defined as T divided by two, based on the assumption that only half as many trucks travel on the roadway during the peak hour, illustrated in Equation 2-7. However, if traffic counts exist to show a higher peak hour truck factor, the observed truck factor can be used as DHT.
It should be noted that truck percentage is usually assumed to be constant over time.